
2018 Fantasy Baseball: 5 and 6 Category Rankings– First Base M-Z
It can be difficult to go back to a standard five category league after experiencing total points. There are so many things that those basic formats don’t encompass. Even adding walks (our sixth category) doesn’t quite tell the whole story. So, when you see these players ranked you have to take that into account. It really isn’t an accurate mark of where these guys are as players. We have to take what we are given in just those categories.
Feel free to look at the companion article to see where these same players were in terms of total points. That article will include the contract information and fielding information for each player. We are including their composite rankings in five and six category formats in this edition along with their performance over the past five seasons.
Jose Martinez—St. Louis Cardinals
| AVG | HR | Runs | RBI | SB | BB | |
| 2017 | .309 | 14 | 47 | 46 | 4 | 32 |
| AVG | .309 | 14 | 47 | 46 | 4 | 32 |
5 Category: 19
6 Category: 20
The Cardinals roster is full of guys like Martinez. They play multiple positions and are all better than bench players, but not quite as good as all-stars. Martinez’s future is murky. They probably want to upgrade at first base. He can also play each corner outfield slot, but he doesn’t play either of them well. So, they will likely go with a modified platoon that will include Stephen Piscotty, Tommy Pham, and Randal Grichuk (along with Martinez). Expect the hot hand to get the at bats. Heaven knows who that could be at this point.
Victor Martinez—Detroit Tigers
| AVG | HR | Runs | RBI | SB | BB | |
| 2017 | .255 | 10 | 38 | 47 | 0 | 36 |
| 2016 | .289 | 27 | 65 | 86 | 0 | 50 |
| 2015 | .245 | 11 | 39 | 64 | 0 | 31 |
| 2014 | .335 | 32 | 87 | 103 | 3 | 70 |
| 2013 | .301 | 14 | 68 | 83 | 0 | 54 |
| AVG | .285 | 19 | 59 | 77 | 1 | 48 |
5 Category: 18
6 Category: 19
Martinez hasn’t exactly been a model of consistency, but even acknowledging that fact we would have to take his aggregate with a grain of salt considering the awesome numbers he put up in 2014. Those aren’t happening again, but his 2013 and 2016 seasons would seem to be a pretty good ceiling to go on. If he produces somewhere between those two he will be a useful fantasy utility player or 1B/3B in those formats.
Joe Mauer—Minnesota Twins
| AVG | HR | Runs | RBI | SB | BB | |
| 2017 | .305 | 7 | 69 | 71 | 2 | 66 |
| 2016 | .261 | 11 | 68 | 49 | 2 | 79 |
| 2015 | .265 | 10 | 69 | 66 | 2 | 67 |
| 2014 | .277 | 4 | 60 | 55 | 3 | 60 |
| 2013 | .324 | 11 | 62 | 47 | 0 | 61 |
| AVG | .286 | 9 | 66 | 58 | 2 | 67 |
5 Category: 21
6 Category: 17
Mauer had the proverbial double whammy of losing his power and moving to a power position. That zapped his traditional fantasy value. He is still a good baseball player overall, but his best skills aren’t counted in a traditional five category format. People that appreciate his skills will likely just become frustrated by his seeming lack of production otherwise. He is best left to a total points format.
Kendrys Morales—Toronto Blue Jays
| AVG | HR | Runs | RBI | SB | BB | |
| 2017 | .250 | 28 | 67 | 85 | 0 | 43 |
| 2016 | .263 | 30 | 65 | 93 | 0 | 48 |
| 2015 | .290 | 22 | 81 | 106 | 0 | 58 |
| 2014 | .218 | 8 | 28 | 42 | 0 | 27 |
| 2013 | .277 | 23 | 64 | 80 | 0 | 49 |
| AVG | .260 | 22 | 61 | 81 | 0 | 45 |
5 Category: 23
6 Category: 24
If you remove 2014 you see a very clear picture of a decent, but not spectacular first basemen/designated hitter. He is the mirror image of Mauer in many ways. He is useful within the five category universe, but his skills outside of those categories are marginal at best. There is a place for a guy that will hit 20 to 25 home runs and drive in close to 90 runs. It’s not the starting lineup necessarily, but there is a place for it somewhere on your roster.
Logan Morrison—Free Agent
| AVG | HR | Runs | RBI | SB | BB | |
| 2017 | .246 | 38 | 75 | 85 | 2 | 81 |
| 2016 | .238 | 14 | 45 | 43 | 4 | 37 |
| 2015 | .225 | 17 | 47 | 54 | 8 | 47 |
| 2014 | .262 | 11 | 41 | 38 | 5 | 24 |
| 2013 | .242 | 6 | 32 | 36 | 0 | 38 |
| AVG | .243 | 17 | 48 | 51 | 4 | 45 |
5 Category: 27
6 Category: 25
This ranking is inappropriate, but it is hard to say what is appropriate. He is better than the aggregate, but likely not as good as he was last season. Plus, it is impossible to predict whether he will land in a spot where he would have an everyday role. We will have to wait and see where he stays in Tampa or signs somewhere where he becomes a part of a platoon. Even in a platoon he is likely better than the average.
Wil Myers—San Diego Padres
| AVG | HR | Runs | RBI | SB | BB | |
| 2017 | .243 | 30 | 80 | 74 | 20 | 70 |
| 2016 | .259 | 28 | 99 | 94 | 28 | 68 |
| 2015 | .253 | 8 | 40 | 29 | 5 | 27 |
| 2014 | .222 | 6 | 37 | 35 | 6 | 34 |
| 2013 | .293 | 13 | 50 | 53 | 5 | 33 |
| AVG | .254 | 17 | 61 | 57 | 13 | 46 |
5 Category: 16
6 Category: 17
Myers fares better in traditional formats because of his speed and power combination. The Padres are reportedly looking for a first basemen. They would likely move Myers to left field in that scenario. That obviously would have a dramatic impact on his value. One more healthy season would likely push Myers into the top dozen first basemen. An ambitious fantasy owner could pick him there and then bank on positional flexibility down the road.
Matt Olson—Oakland Athletics
| AVG | HR | Runs | RBI | SB | BB | |
| 2017 | .259 | 24 | 33 | 45 | 0 | 22 |
| AVG | .259 | 24 | 33 | 45 | 0 | 22 |
5 Category: 29
6 Category: 30
Obviously, this ranking is a bit out of whack as compared to what he would be projected to do. Baseball-reference projects him to have an .888 OPS in 2018. Steamer has him projected to have a .796 OPS. If we split the difference we will see a guy that likely will come in around .250/.350/.480 slash line with 30 or more home runs. In six category leagues that’s good enough to be a starter at first base or utility.
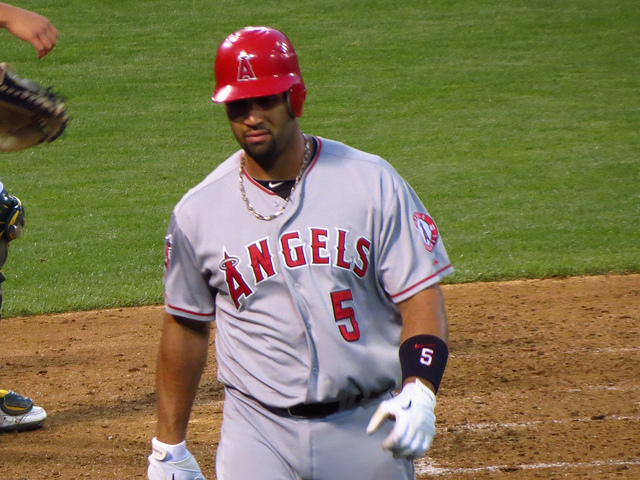
Albert Pujols—Los Angeles Angels
| AVG | HR | Runs | RBI | SB | BB | |
| 2017 | .241 | 23 | 53 | 101 | 3 | 37 |
| 2016 | .268 | 31 | 71 | 119 | 4 | 49 |
| 2015 | .244 | 40 | 85 | 95 | 5 | 50 |
| 2014 | .272 | 28 | 89 | 105 | 5 | 48 |
| 2013 | .258 | 17 | 49 | 64 | 1 | 50 |
| AVG | .257 | 28 | 68 | 97 | 4 | 45 |
5 Category: 12
6 Category: 14
No player has driven in more than 100 runs and scored fewer runs than Pujols did last season. He had a similar gap in 2016 as well. It might seem like pointless trivia, but it does indicate a problem with picking Pujols for your team. Maybe the Angels improve overall with Justin Upton on their team for a whole season. Unfortunately, that doesn’t bring Pujols any closer to his prime and depending on the batting order may actually take some of his RBIs away.
Hanley Ramirez—Boston Red Sox
| AVG | HR | Runs | RBI | SB | BB | |
| 2017 | .242 | 23 | 58 | 62 | 1 | 51 |
| 2016 | .286 | 30 | 81 | 111 | 9 | 60 |
| 2015 | .249 | 19 | 59 | 53 | 6 | 21 |
| 2014 | .283 | 13 | 64 | 71 | 14 | 56 |
| 2013 | .345 | 20 | 62 | 57 | 10 | 27 |
| AVG | .281 | 21 | 65 | 71 | 8 | 43 |
5 Category: 10
6 Category: 12
The aggregate sometimes doesn’t make a whole lot of sense when we look at each season individually. Ramirez is either really good or not all that effective. There is no real reason to think he will accomplish some middle ground. It is probably best to take a wait and see approach on him. At best, you might be able to take him in the later rounds and hope you catch lightening in a bottle.
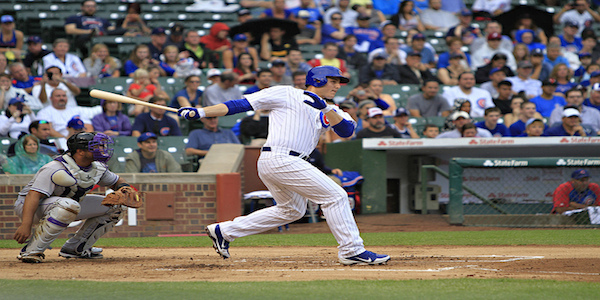
Anthony Rizzo—Chicago Cubs
| AVG | HR | Runs | RBI | SB | BB | |
| 2017 | .273 | 32 | 99 | 109 | 10 | 91 |
| 2016 | .292 | 32 | 94 | 109 | 3 | 74 |
| 2015 | .278 | 31 | 94 | 101 | 17 | 78 |
| 2014 | .286 | 32 | 89 | 78 | 5 | 73 |
| 2013 | .233 | 23 | 71 | 80 | 6 | 76 |
| AVG | .272 | 30 | 89 | 95 | 8 | 78 |
5 Category: 3
6 Category: 2
We can remove Rizzo’s 2013 campaign and get a much more realistic look of where he is as a player. That would make him a .282/32/94/99/9/79. Those numbers cement him as at worst the third best first basemen on the board. Depending on how much you value steals, you might even select him second before Paul Goldschmidt. The Cubs have a better offense overall, so he probably has a better chance of putting up bigger numbers moving forward.
Carlos Santana—Free Agent
| AVG | HR | Runs | RBI | SB | BB | |
| 2017 | .259 | 23 | 90 | 79 | 5 | 88 |
| 2016 | .259 | 34 | 89 | 87 | 5 | 99 |
| 2015 | .231 | 19 | 72 | 85 | 11 | 108 |
| 2014 | .231 | 27 | 68 | 85 | 5 | 113 |
| 2013 | .268 | 20 | 75 | 74 | 3 | 93 |
| AVG | .250 | 25 | 79 | 82 | 6 | 100 |
5 Category: 12
6 Category: 10
Santana presents a significant problem for thinking fans. We know he is better than this, but his track record is pretty consistent. This is who he is as a five-category guy. Add in the on base element and he is significantly more valuable, but even then he has his limits in the fantasy game. Total points obviously treats him better, but that is reserved for mostly daily formats. So, we have to shut off our brain for a moment and take some lesser players before him.
Justin Smoak—Toronto Blue Jays
| AVG | HR | Runs | RBI | SB | BB | |
| 2017 | .270 | 38 | 85 | 90 | 0 | 73 |
| 2016 | .217 | 14 | 33 | 34 | 1 | 40 |
| 2015 | .226 | 18 | 44 | 59 | 0 | 29 |
| 2014 | .202 | 7 | 28 | 30 | 0 | 24 |
| 2013 | .238 | 20 | 53 | 50 | 0 | 64 |
| AVG | .231 | 19 | 49 | 53 | 0 | 46 |
5 Category: 30
6 Category: 28
Smoak is one of those impossible cases to correctly predict. He isn’t as good as he was last season or as bad as he was the previous seasons. The best we can do is eliminate 2014 and go from there. If we extrapolate that out we get .238/23/54/58/0/52. Even that seems like an inadequate guess. The tough question is how much of last season was a step forward and how much was out of context performance. Proceed with caution, but he probably should go off the board at some point.
Eric Thames—Milwaukee Brewers
| AVG | HR | Runs | RBI | SB | BB | |
| 2017 | .247 | 31 | 88 | 63 | 4 | 75 |
| AVG | .247 | 31 | 88 | 63 | 4 | 75 |
5 Category: 13
6 Category: 12
Let’s assume for the sake of argument that this is who Thames is. That by itself is a dangerous assumption given his fast start and slow finish. He has raw power and good patience on his side, but there is also a ton of swing and miss in his game. It’s hard to say whether the Brewers will continue to remain patient with that combination. Thames has outfield and first base eligibility, so there is value there, but the rankings don’t seem to be appropriate. He probably belongs on a fantasy bench more than in a lineup.
Joey Votto—Cincinnati Reds
| AVG | HR | Runs | RBI | SB | BB | |
| 2017 | .320 | 36 | 105 | 100 | 5 | 134 |
| 2016 | .326 | 29 | 101 | 97 | 8 | 108 |
| 2015 | .314 | 29 | 99 | 80 | 11 | 143 |
| 2014 | .255 | 6 | 32 | 23 | 1 | 47 |
| 2013 | .305 | 24 | 101 | 73 | 6 | 135 |
| AVG | .304 | 25 | 87 | 75 | 6 | 113 |
5 Category: 5
6 Category: 4
Let’s start by removing his injury shortened 2014 campaign. Suddenly, you are looking at a .316/30/102/87/8/128 player. Those walks in combination with the batting average make him the most valuable offensive performer in the sport in those four seasons. Unfortunately, he is not so dominant when you compare the run producing categories. Thus marks the starkest difference between real baseball and fantasy baseball. You can’t ignore it. Sometimes you have to bite your lip and give in to more primitive forces.
Ryan Zimmerman—Washington Nationals
| AVG | HR | Runs | RBI | SB | BB | |
| 2017 | .303 | 36 | 90 | 108 | 1 | 44 |
| 2016 | .218 | 15 | 60 | 46 | 4 | 29 |
| 2015 | .249 | 16 | 43 | 73 | 1 | 33 |
| 2014 | .280 | 5 | 26 | 38 | 0 | 22 |
| 2013 | .275 | 26 | 84 | 79 | 6 | 60 |
| AVG | .265 | 20 | 61 | 69 | 2 | 38 |
5 Category: 20
6 Category: 20
On a long enough timeline, the survival rate drops to zero. Every generation has guys like Zimmerman. They are the Don Mattinglys and Tony Olivas of the past. This isn’t to say that he is as good, better, or worse than those guys necessarily. It is just to say that Nationals fans will look back and wonder what might have been had he been able to stay healthy. That means seasons like 2017 are bound to happen. They just stand as a testament to what might have been. Those seasons rarely repeat themselves. The aggregate is oddly appropriate even though he rarely produces at that level. He will either come in above or below that. I’m betting the under.