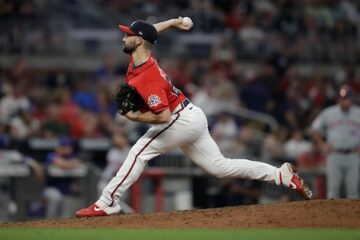
2013 Fantasy Baseball: You Should Be Concerned About Josh Johnson


When fantasy owners hear the name Josh Johnson, many of them correctly understand the inherent risk/reward potential that he brings. The question heading into the 2013 MLB season is whether fantasy owners have assessed Johnson’s risk factors accurately enough. Personally, I don’t believe we have.
In 2008, Josh Johnson pitched 87 innings in an injury shortened campaign following Tommy John surgery. His peripherals during that season were a 7.94 K/9 and 2.78 BB/9 with a 9% HR/FB rate. The seasons that followed improved linearly in each of those three categories up to and including 2010. His 2010 peripherals looked like this: 9.11 K/9 and 2.35 BB/9 with a 4.2% HR/FB rate. Again, 2008, 2009, and 2010 all contained a 3-year steady improvement phase in each category listed.
Johnson’s 2011 campaign featured yet another injury shortened season, but in his short 60 IP sample size, he was already experiencing declines. His K/9 dipped to 8.35 and his BB/9 raised back up to 2.98 (highest since his rookie season).
In 2012 Johnson received a new pitcher friendly stadium to work with at home, and he recorded his worst peripherals since his rookie year. His K/9 fell once again (for a two year decline) to 7.76 and his BB/9 rose again ( twoyear increase) to 3.06. His HR/FB also increased back up to 8.4%.
After a 3-year improvement trend, Johnson has now seen a 2-year decline trend. Now he heads into Toronto for the pivotal 3rd year in his potential decline phase. Toronto has a very hitter-friendly ballpark (especially for home-runs) and is in the 2nd toughest division in baseball, as well as being in a league with all-around much better teams and much more offense.
And it gets worse.
Here’s a look at Josh Johnson’s fastball data over the past few years: (via the great folks at brooksbaseball.net)
In 2010, Johnson threw his fastball 60% of the time at an average velocity of 95.62 mph. Other stats during that season for Johnson include: 23.94% Whiff/Swing rate (24% of the time a batter swung at Johnson’s fastball, he missed), a GB rate of 45%, and a HR/(FB+LD) of 3.17%
In 2011, Johnson threw his fastball 56% of the time at an average velocity of 94.45 mph. Here is the 2011 version of the three earlier stats: 13.68% Whiff/Swing rate (incredible dropoff), a GB rate of 47.73% and a HR/(FB+LD) of 4.88%.
In 2012, Johnson threw his fastball 51% of the time at an average velocity of 93.53 mph. Again, here is the 2012 version of the earlier stats: 12.18% Whiff/Swing, 39.86% GB rate, 30% FB rate, and a HR/(FB+LD) of 6.58%
Unfortunately, I don’t have hard hit ball data available to me for the fastball, but to put it even more into perspective, consider this: Johnson’s GB rate of 39.86% on the fastball is 10% lower than his 2nd lowest GB rate on any other pitch. His changeup comes in at 56.67% and his slider at 50%. Furthermore, the fly-ball rate of 30% is considerably higher than that of any other pitch.
Still not concerned? Here’s this final piece of data, once again from brooksbaseball.net
- In 2010, his fastball slash line was .246/.362/.104/.244 – Batting Average, Slugging, Isolated Power, TAv – true average
- In 2011: .236/.340/.104/.237
- In 2012: .296/.469/.161/.296
Adding an improved curveball to his arsenal, like he did in 2012, will aid his strikeout rate and mitigate the damage done by his fastball decline, but it’s not going to reduce the number of home-runs and hard contact he allows on his fastball. Pitching in Toronto is only going to magnify that even further. Let Josh Johnson be someone else’s problem in 2013.


