
Starting Pitchers: Like Him Less, Like Him More
An all-star starting pitcher from 2015 has some serious red flags I’m unable to overlook. He’s joined by a righty whose ERA estimators were more than a run better than his ERA in 2015, but the ERA estimators don’t tell the whole story. On the positive side of things, a slow-ish start resulted in very good but not elite numbers for a Cleveland right-hander. Also, a second-year starter for the Mets is poised to build on his huge rookie season as opposed to suffering through a sophomore slump.
Like Him Less
Sonny Gray – ECR: SP-21, My Rank: SP-47
Sonny Gray dominated the competition in the first half last year. He spun a 2.04 ERA with a 22.4% strikeout rate, 6.2% walk rate, 0.96 WHIP and strong ERA estimators (2.69 FIP and 3.40 xFIP). He collapsed in the second half, and his ERA estimators tell an even scarier tale than his ERA. In the second half, Gray tallied a 3.74 ERA, 17.5% strikeout rate, 8.3% walk rate, 1.26 WHIP, 4.57 FIP and 4.10 xFIP.
A half of data is a small sample size, and under normal circumstances, it would be easy to dismiss Gray’s gap in production between halves as being little more than normal variance. The PITCHf/x data for Gray from last year is alarming. His fourseam fastball and sinker average velocity peaked at 95.06 mp and 94.94 mph, respectively, in May, according to Brooks Baseball. His velocity dropped every subsequent month and bottomed out at 92.85 mph for the fourseam fastball and 92.82 mph for the sinker in September. That’s greater than a two mph velocity drop during the season. It’s possible he wore down as the season went on, but there’s another red flag in his PITCHf/x data that provides reason to pause.
Gray’s best secondary offering was his slider. For the season, he threw it 16.69% of the time and it featured a filthy 24.41% whiff rate. The pitch was more effective at missing bats early in the season with a 33.33% whiff rate in April and a 28.24% whiff rate in May. The whiff rate on the pitch was under 25% in June through September and was under 20% in June and September. His usage peaked in May (22.39%) and remained high in June (21.89%), but the pitch’s usage was under 17% from July through September and hit a season-low 8.89% usage rate in September. If Gray’s velocity doesn’t bounce back, it will likely impact his strikeout rate, and he’ll need to get back to using his slider more often even if the velocity does return. I’m avoiding him altogether this season, but if you are rostering him, keep tabs on his PITCHf/x data early as it could be very telling for his season-long value.
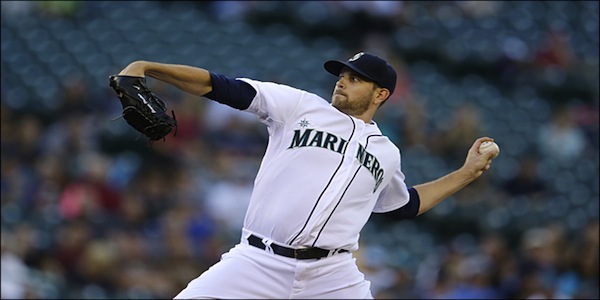
Michael Pineda – ECR: SP-33, My Rank: SP-44
At first blush, it’s easy to see why Michael Pineda ranks as a top-35 starting pitcher for the ECR. He brings a lot to the table. Among starters who pitched a minimum of 160 innings in 2015, Pineda ranked 21st in FIP (3.34), eighth in xFIP (2.95), 10th in K-BB% (20.2%) and tied for 14th in swinging strike rate (11.9%), according to FanGraphs.
Be careful about projecting him to his ERA estimators, though. The righty has basically pitched two and a half seasons in the majors, and his ERA has been higher than his ERA estimators in the two full seasons but lower than the estimators in his half season. He needed a 80.4% LOB% in 2014 to record a 1.89 ERA (2.71 FIP and 3.37 xFIP), and it’s actually his ability (or perhaps inability) to strand runners that makes him reluctant to project him for a low- to mid-threes ERA.
For his career, Pineda owns a 70.7% LOB%, and his strand rate was below 70% last year (68.6% to be exact) and in 2011 (69.7%). Ugly strand rates are nothing new for Pineda, either. In 10 appearances (eight starts) at the High-A level in 2009 he tallied a 67.9% LOB%, and in 12 starts at the Triple-A level in 2010 he finished with a 66.8% LOB%. For his big league career, Pineda has allowed a .324 wOBA with runners on base and held batters to a .268 wOBA with the bases empty. The righty does a good job of limiting walks and piling up strikeouts whether runners are on base or the bases are empty, but he gives up less forgiving contact to batters when facing them with runners on. His line drive rate allowed jumps from 18.3% when the bases are empty to 23.5% with men on base, and his hard-hit ball rate goes up from 25.5% to 28.8%. Pineda’s a good pitcher and a fantasy baseball asset, but his glowing ERA estimators will likely always assure him a higher draft spot than I’m willing to invest to secure his services.
Like Him More
Carlos Carrasco – ECR: SP-16, My Rank: SP-6
Carlos Carrasco was a stud in 2015 even if his 3.63 ERA begs to differ. Among qualified starters last year, Carrasco ranked fourth in strikeout rate (29.6%), tied for 27th in walk rate (5.9%), ninth in FIP (2.84), fourth in xFIP (2.66), fourth in SIERA (2.74) and fifth in swinging strike rate (14.0%). He even adds an impressive 51.2% ground-ball rate to the mix. His arsenal is filthy, and Eno Sarris of FanGraphs breaks it down in depth here. Carrasco’s repertoire includes two pitches — a slider and curve — that netted whiff rates north of 25% last year, per Brooks Baseball, and two more above 10% (10.79% on the sinker and 19.12% on the change). He has no shortage of weapons at his disposal to rack up strike threes.
Carrasco was much better in the second half than in the first, and it’s likely not a coincidence that his numbers improved with Francisco Lindor and Giovanny Urshella manning the left side of the infield. Juan Uribe will man the hot corner for the Indians this year, but he’s a defensive asset and will pair nicely with Lindor on the left side of the infield. Jason Kipnis is also coming off of a career-best defensive score, and if he’s able to be a plus defender once again this season, it would help the ground-ball hurler immensely. In 44 starts for the Indians since 2014, Carrasco owns a 2.63 FIP and 2.61 xFIP, and I expect him to pitch to the tune of a sub-three ERA with one of the highest strikeout totals in the league this season.
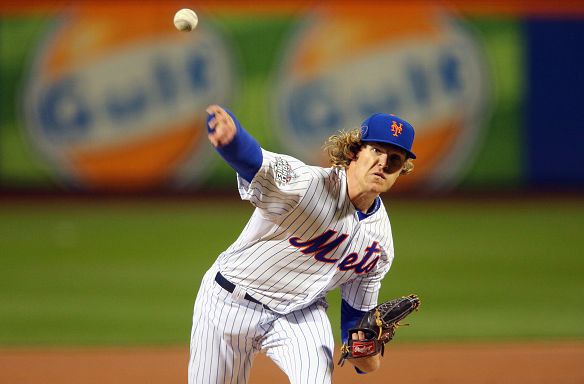
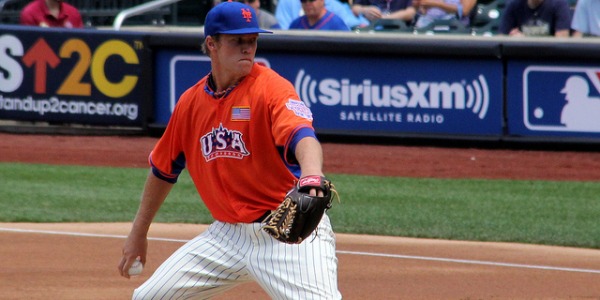
Noah Syndergaard – ECR: SP-17, My Rank: SP-9
Noah Syndergaard had a scintillating rookie season. Among starters who pitched a minimum of 150 innings, he ranked seventh in strikeout rate (27.5%), tied for 16th in walk rate (5.1%), 21st in FIP (3.25), seventh in xFIP (2.91), seventh in SIERA (2.95) and 13th in swinging strike rate (12.2%). He also did a solid job of inducing ground balls with a 46.5% ground-ball rate.
Thor’s stuff is drool inducing. His fourseam fastball and sinker both averaged over 97 mph last year, and they were backed by a changeup, slider and curve with the hammer curve checking in with an average velocity of 81.21 mph. A 16 mph gap in average velocity between his cheddar and his curve is huge and can result in hitters looking foolish. All of Syndergaard’s pitches have strong whiff rates with his sinker bringing up the rear (9.67%) and his slider leading the way (24.42%). Thor’s hammer curve netted a 19.17% whiff rate, and his 45.45% whiff/swing rate was the fifth highest on a curve ball thrown a minimum of 200 times by a starter in 2015, per Baseball Prospectus.
Syndergaard’s deep, electric arsenal gives him all the goodies he needs to get lefties and righties out. Last year, he allowed just a .296 wOBA to lefties and was totally death on righties allowing only a .262 wOBA to them. It’s likely the primary reason for the gap in ECR rank and mine is due to innings pitched expectations for 2016. Last year, Syndergaard tallied 198.2 innings after including his time in the minors and postseason innings. He has no innings restriction this year, and I fully expect him to surpass 200 innings this year.