
The Atlanta Braves and the Big Fly in 2014
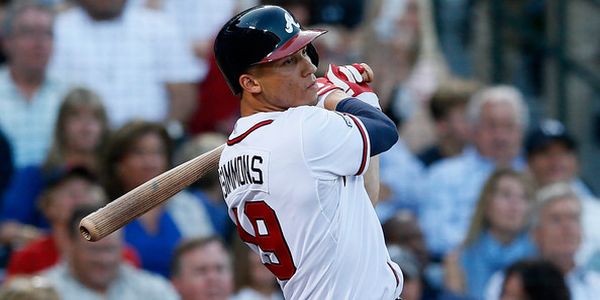

After recently profiling Andrelton Simmons for fantasy relevance in 2014, I noted that he had a 12% increase in his fly ball rate from 27% to 39% as well as an outlandish 17.8% popup rate, the latter of which led the majors last year. It seemed extraordinary that a guy with a career fly ball rate of 25% and a career popup rate of 8.6% in the minors would, out of nowhere, start trying to get the ball in the air at such a prolific rate (he ended up #35 in the league, ahead of sluggers like Josh Hamilton, Adrian Gonzalez, and Giancarlo Stanton). When you consider that Simmons hadn’t hit more than 9 career home runs in his entire major and minor league career before 2013, I couldn’t fathom why Simmons of all people wouldn’t be using his decent speed to beat out grounders instead of trying to put one in the seats.
Furthermore, I noted during a few Braves’ broadcasts last year the commentators talking about the Braves being an all-or-nothing team at the plate. They were, in effect, living and dying by the long ball. Sure enough when I ran the numbers, I found out that from the 2012 to 2013 seasons, the Braves went from 17th in runs scored to 13th and 20th in home runs to fifth. This confirmed for me, in a sense, that the commentators were right—the Braves were definitely hitting more home runs last year. Was it, though, a result of an overall shift in philosophy of hitting or just statistical noise.
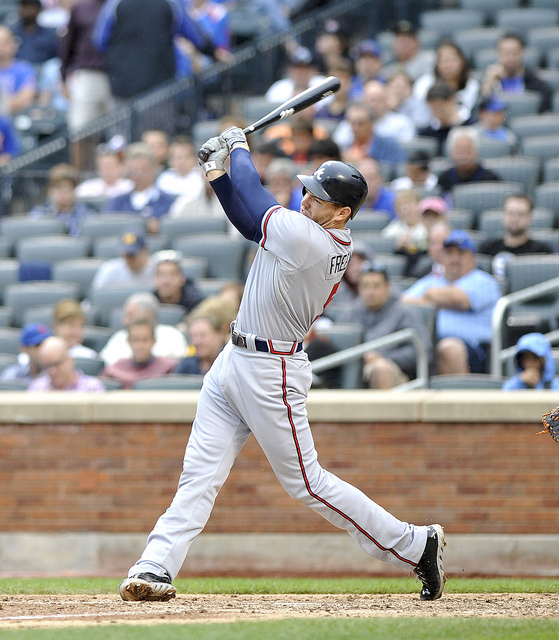
You may be wondering how this is fantasy relevant, so let me get to the point: If the Braves are now all about the long ball, this could affect how and where you draft, say Freddie Freeman, Justin Upton, or Jason Heyward since more long balls can represent greater fantasy value, unless the long balls come with unintended consequences that we’ll talk about below.
The Past and the Present (2008-2013)
It seemed logical that as the 1990s through 2010 was the well-known Bobby Cox era in Atlanta, there would be a new system and philosophy when manager Fredi Gonzalez took over the reigns in 2011. I decided to compare the average batted ball, plate discipline, and standard stats from the last three years of Cox’s tenure to the first three of Gonzalez to see if there were any discernable differences. Of course, the elephant in the room is that there’s no way I could call these comparisons valid as there are way too many variables (not the least of which is different players on the roster). Nonetheless, it’s interesting to look at changes in any organization under different management, and so below is batted ball data under the two “regimes”:
| Season | BABIP | GB/FB | LD% | GB% | FB% | IFFB% | HR/FB |
|---|---|---|---|---|---|---|---|
| 2008-10 | 0.303 | 1.26 | 20.27% | 44.30% | 35.43% | 8.03% | 8.87% |
| 2011-13 | 0.293 | 1.29 | 19.97% | 45.03% | 35.03% | 10.73% | 11.57% |
Nothing much to note here, as LD%, GB%, and FB% all remain largely unchanged. However, there are a couple of significant differences: first, notice the 23% increase in the HR/FB ratio coupled with a 25% increase in IFFB rates. Furthermore, there has been a slight 3.3% decrease in BABIP as well, most likely due to the increase in popups across the board. At the least this is some proof that the Braves have indeed been about the long ball the last few years and an ugly consequence of that is that the more times you put the ball in the air the more chance you could pop the ball up.
Ok, maybe that’s not significant enough for you. However, the plate discipline data is a little more revealing:
| Season | O-Swing% | Z-Swing% | Swing% | O-Contact% | Z-Contact% | Contact% | Zone% | F-Strike% | SwStr% |
|---|---|---|---|---|---|---|---|---|---|
| 2008-10 | 25.37% | 65.40% | 45.00% | 63.70% | 88.10% | 81.13% | 48.87% | 57.90% | 8.27% |
| 2011-13 | 30.40% | 66.37% | 46.37% | 64.77% | 85.20% | 77.77% | 44.40% | 58.93% | 10.07% |
Here we go. The first thing I notice off the bat is that the Braves are flailing outside the zone 17% more than they used to, and in general they are swinging more. And yet, other than a slight uptick in O-Swing%, which comes with swinging more in general, they are making 4% less contact across the board. Couple that with an 18% increase in swinging-strike rate and you have some troubling trends. When I analyze specific players with this profile: swinging more, making less contact, and whiffing more then I start raising the red flags.
| Team | FB% Diff | HR/FB% Diff | IFFB% Diff | Contact% Diff | SwStr% Diff |
|---|---|---|---|---|---|
| Angels | 0.40% | -1.70% | -3.00% | -2.20% | 0.90% |
| Astros | -1.10% | 0.80% | 0.00% | -2.90% | 1.70% |
| Athletics | 2.10% | -1.70% | -1.10% | 2.50% | -0.90% |
| Blue Jays | -0.90% | -1.00% | 0.00% | 2.50% | -1.30% |
| Braves | 2.40% | 1.80% | 1.00% | -2.00% | 1.40% |
| Brewers | -3.10% | -1.90% | -0.20% | 0.80% | 0.00% |
| Cardinals | 0.40% | -2.60% | -0.20% | 0.70% | -0.40% |
| Cubs | 3.60% | 1.00% | 0.10% | -0.40% | 0.10% |
| Diamondbacks | -4.10% | -1.90% | -0.20% | 1.70% | -0.70% |
| Dodgers | 2.20% | 0.80% | 0.70% | -0.90% | 0.70% |
| Giants | 1.50% | -0.10% | -1.30% | 0.30% | -0.10% |
| Indians | 2.80% | 2.10% | -2.50% | -2.60% | 1.20% |
| Mariners | 1.60% | 2.10% | -2.50% | -1.70% | 0.60% |
| Marlins | -4.30% | -2.00% | 2.00% | 0.30% | 0.50% |
| Mets | 3.30% | -1.50% | 1.30% | -2.00% | 1.40% |
| Nationals | -1.00% | -1.80% | -1.20% | 3.00% | -1.90% |
| Orioles | 0.90% | -1.30% | 0.70% | 2.20% | -0.90% |
| Padres | 0.30% | 1.70% | 0.10% | -0.80% | 0.70% |
| Phillies | 1.60% | -1.30% | -0.10% | -2.10% | 1.10% |
| Pirates | -2.10% | -0.10% | -0.20% | -1.00% | 0.30% |
| Rangers | 0.10% | -1.60% | 1.70% | 3.00% | -1.80% |
| Rays | -1.30% | -1.20% | -2.20% | 2.80% | -1.30% |
| Red Sox | -0.50% | 1.10% | 0.70% | -1.60% | 0.20% |
| Reds | -2.50% | -0.50% | -2.20% | -0.80% | 0.40% |
| Rockies | 0.40% | -0.70% | -1.00% | 0.40% | 0.20% |
| Royals | 0.20% | -1.10% | -0.10% | -0.20% | 0.00% |
| Tigers | -0.40% | 0.30% | 0.40% | 0.40% | -0.30% |
| Twins | 4.80% | 0.70% | -0.60% | -5.60% | 2.60% |
| White Sox | 0.10% | -4.20% | -0.70% | -0.50% | 0.40% |
| Yankees | 1.60% | -7.10% | 0.90% | 0.70% | 0.00% |
As you can see in the table above the Braves’ posted the fourth largest increase in fly ball percentage, tied for the second in largest increase in HR/FB%, and dubiously, the third largest increase in IFFB% in the league from 2012 to 2013. Additionally, they made less contact overall (Contact%) than all but 5 teams and had tied for the third largest increase in whiff rate (SwStr%) from 2012 to 2013. It is clear that the Braves hitters have been and are trending in the wrong direction as hitters. On the one hand, they are swinging more, inside and outside the zone, making less contact, and whiffing more—none of which are good things when taken together as a whole—but on the other hand they are hitting more fly balls (not in itself a good thing), hitting more home runs per fly ball, but also popping the ball up at a high rate (fifth overall in the league).
Conclusions
How could this affect your team in terms of fantasy? Let’s look at all of the players (except rookies) from last year’s Braves’ squad, identify individual batted ball/plate discipline differences from 2012 to 2013, and break them down individually below. Furthermore, I’ve included their current ADP according to NESN along with Zach Sanders’ end of seasons rankings difference from 2012 to 2013 as well:
| Name | Pos | 2014 ADP | Contact% Diff | SwStr% Diff | FB% Diff | HR/FB% Diff | IFFB% Diff | EOS Diff |
|---|---|---|---|---|---|---|---|---|
| Freddie Freeman | 1B | 25 | -0.10% | 0.60% | -1.70% | 0.20% | -5.10% | 9 |
| Dan Uggla | 2B | 377 | 3.20% | 1.50% | 0.70% | 5.30% | -3.30% | -10 |
| Chris Johnson | 3B | 259 | -0.30% | 0.90% | -7.50% | -1.00% | 3.70% | 8 |
| Andrelton Simmons | SS | 144 | -0.10% | -0.30% | 11.90% | 0.40% | 0.30% | n/a |
| Justin Upton | OF | 41 | -5.40% | 2.30% | 2.20% | 6.90% | -3.70% | -4 |
| Jason Heyward | OF | 78 | 4.60% | -2.60% | -1.70% | -3.90% | 8.60% | -62 |
| BJ Upton | OF | 215 | 3.70% | 0.40% | -5.00% | -6.50% | 9.20% | -77 |
There’s not a whole lot to conclude from the table above as there are no “wholesale” changes occurring in the lineup as far as batted ball/plate discipline data from 2012 to 2013. Simmons’ fly ball percentage looks like it is propping up the Braves’ increase overall as a team. Furthermore, Heyward and B.J. Upton’s popups may be doing the same for the Braves’ IFFB% as well. It might be interesting to look after the end of this season to assess the Upton brothers’ changes in Atlanta from year one to year two since 2013 was their first year with the organization.
Regardless, it’s undeniable that whatever Atlanta’s team hitting philosophy is, it is having both positive and negative results. First, they are hitting more home runs, and they are also hitting more popups. While home runs are nice, especially for fantasy purposes, the popups are disturbing in light of the fact that popups invariably mean more outs. Second, their plate discipline is suffering which could lead to a slight dip in OBP and BABIP as they swing more and make less contact. All of these factors could lead to a decrease in batting average. Third, it might also include a bump in homers (with less runs—notice they jumped 15 spots in HR as a team last year when compared with a modest four team bump in runs scored) as well as their HR/FB rates have gone up.
There are obviously too many factors involved to say that the Braves have initiated a wholesale change in hitting approach in the Fredi Gonzalez era. However, it is safe to say that the Braves’ hack-tastic plate discipline trends could be a blessing (more HR) and a curse (less runs, average, on base percentage) for fantasy owners this year.
1 Comment
Of course there are other ways to stop that other people find helpful,
the same method doesn. Smokers who are trying hard to give up the dangerous habit
now have the option of a new nicotine replacement therapy that gives them the experience and satisfaction of smoking without the harmful chemicals, the offensive odors and the humiliating sense of becoming social pariahs.
There’s a delicate balance between providing you with a good quality
smoke and making it affordable.