
The Hall of Fame Index: Justin Verlander vs. Clayton Kershaw and Early Wynn
We finally get to the pitchers. This is the last of our series of articles where we compare current players with those they are similar to. In this edition we actually get a two for one. There are two active pitchers that are similar according to the Hall of Fame Index. It’s always fun comparing contemporaries because we don’t necessarily have to worry about the differences in the era they played.
There are also obviously more intense feelings about those players as well. In this case we have two guys that no one really doubts will be in the Hall of Fame some day. They’ve both won multiple Cy Young Awards and probably deserved more. The only thing left is to determine who is better. We will also compare them with someone already in the Hall of Fame. Of course, comparing pitchers is different than position players. We don’t really worry about fielding and we get disagreements over what makes a good pitcher. We will cover that ground.
Career Value
| BWAR | FWAR | WS/5 | Total | |
| Justin Verlander | 71.6 | 72.0 | 47.4 | 191.0 |
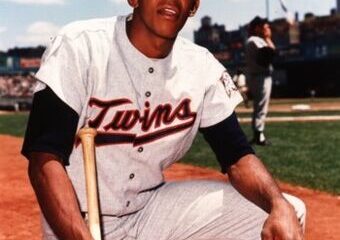
| Early Wynn | 61.1 | 67.7 | 61.8 | 190.6 |
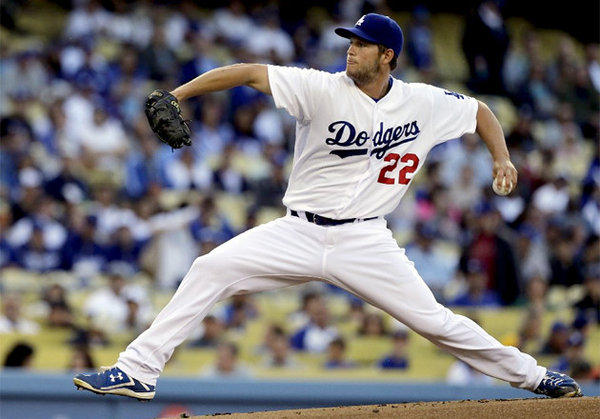
| Clayton Kershaw | 67.9 | 66.4 | 40.2 | 174.5 |
We go into this in more detail in the book (only $5.99 in Kindle format) but we notice huge discrepancies between the WAR formulas and win shares. Simply put, there is a disagreement as to how much pitchers control. WAR considers differences between hard and soft contact differently than win shares. It gives more credit to pitchers that strikeout more hitters because it adheres to defensive independent pitching statistics. Win shares adheres more to a simple model of who prevented runs as compared to a replacement level pitcher.
Win shares gives more credit for the number of innings you actually pitch. So, someone like a Wynn will get more credit because he hurled more innings each year. Wynn hurled more than 4500 innings where Kershaw and Verlander haven’t gotten to 3000 innings yet. It is hard to imagine either getting to 4000 innings at this point in their careers. So, Wynn will likely retain the advantage in that category.
This all comes together to create what looks like a mess. However, the concept of the index was to get a cross-section of sabermetric analysis on players. Having a combination of metrics that focus on durability and how much pitchers actually control what goes on gives us a dimension we wouldn’t have with just one. It also means I don’t use the index to determine who is/was actually better. We use our other tests to help with that.
Peak Value
| BWAR | FWAR | WS/5 | Total | Index | |
| Verlander | 56.3 | 55.8 | 35.4 | 147.5 | 338.5 |
| Kershaw | 63.3 | 61.7 | 36.8 | 161.8 | 336.3 |
| Wynn | 45.0 | 44.5 | 39.8 | 129.8 | 319.9 |
Anyone that knows me knows I am a huge Houston Astros fan. That being said, I cannot support Verlander over Kershaw. Kershaw’s peak value demonstrates he is likely to overtake Verlander a year or two after Verlander finally hangs them up. Verlander has certainly been impressive in his time in Houston, but Kershaw is the yardstick that all modern pitchers will be measured against.
The 300-win plateau isn’t likely to be surpassed again with the way the modern game is played, but Kershaw will likely be compared to Greg Maddux and Pedro Martinez when all is said and done. None of them dominated with an overwhelming fastball. Still, they dominated just the same. Verlander is excellent, but he just won’t finish on that level. Wynn didn’t have that level of excellence either. That will be seen in more clear detail when we look at the pitching numbers.
Pitching Statistics
| Wins | PCT | ERA+ | WaaPCT | DIFF | |
| Kershaw | 169 | .695 | 157 | .636 | +.059 |
| Verlander | 225 | .636 | 129 | .598 | +.038 |
| Wynn | 300 | .551 | 107 | .524 | +.027 |
You are probably familiar with every statistic except WaaPCT. It stands for wins above average percentage. In another words, if a pitcher had average run support and fielding support they would win games at that percentage. Kershaw has clearly gotten some help from pitching in Dodger Stadium and on good teams, but he would be a dominant pitcher anywhere he pitched.
Still, if he retired today he would have the highest winning percentage in baseball history of anyone with more than 200 decisions. His ERA+ would also be in the top five all-time for pitchers with more than 2000 innings. These numbers more than the index numbers indicate that any pick other than Kershaw for the top spot of the current era is an erroneous one. I love me some Justin Verlander, but I just can’t make that pick in good faith.
Wynn pitched in a different era when strikeouts were not nearly as plentiful. So, he isn’t going to look good when we compare him with two pitchers that are striking out hitters at the clip that they are. Furthermore, both Kershaw and Verlander are known for their impeccable control. So, Wynn doesn’t have a chance in peak value, but he makes up for it with his longevity and durability.
Playoff Statistics
| W-L | INN | ERA | SO/BB | |
| Verlander | 14-11 | 187.2 | 3.40 | 205/60 |
| Kershaw | 9-11 | 158.1 | 4.43 | 170/45 |
| Wynn | 1-2 | 20.0 | 4.95 | 15/6 |
Verlander has more postseason strikeouts than any pitcher in history. His numbers certainly look good here, but they aren’t without their warts. It wouldn’t be completely out of the question to see him eclipse Andy Pettitte’s 19 wins in the postseason, but he is an embarrassing 0-6 in World Series games with a robust 5.68 ERA. That includes two crushing defeats in the World Series last season. The last loss came in a game where the Astros could have closed out the Nationals.
That also means he is 14-5 in the divisional round and the league championship series. So, it’s not all bad, but it is definitely a mixed bag. Kershaw is 1-2 in World Series play with a 5.40 ERA. He famously blew two leads in Game 5 of the 2017 World Series. He was even worse in the 2018 World Series. Unlike Verlander, he has underperformed relative to his regular season performance at all three levels.
It is easy to get caught up in reputations and put too much stock in that. Ten years or twenty years from now, people will naturally compare these two to Madison Bumgarner and it will be tempting to consider Bumgarner the better pitcher. That might be true strictly based on October, but we have to throw all of it into the recipe to bake the cake.
BWAR Cy Young Points
| Top 10 | Top 5 | CY | Points | |
| Kershaw | 1 | 4 | 3 | 53 |
| Verlander | 2 | 3 | 3 | 51 |
| Wynn | 2 | 2 | 2 | 36 |
Let’s do some simple math. When Wynn pitched there were eight teams in each league. Those eight teams used four-man rotations. So, even in a perfect season there might have been between 25 and 30 pitchers that qualified for an ERA title (154 innings). Finishing in the top ten in BWAR in those conditions is not particularly special. Modern pitchers have 15 team leagues with five-man rotations. So, we might have twice as many pitchers pitch 150 innings or more.
We see that Kershaw and Verlander both deserve three awards. Ironically, Verlander probably didn’t deserve the 2019 award. Gerrit Cole was slightly more dominant, but Verlander had the most wins and the no-hitter close to the end of the season. That was probably enough to make the difference. Meanwhile, Kershaw has been too banged up to win it more often than he has. When he’s healthy he almost always wins.