
2014 Total Run Index: Starting Pitchers 11-20
In the last edition of the starting pitching countdown, I introduced a term that really isn’t all that new. I simply applied an official sounding term called “substitution value.” The whole idea behind substitution value is to look at a player’s value as not an absolute value (above replacement, average, or any other method) but to look at his value as compared to the next available player at his position. Major League executives and scouts shouldn’t do that, but fantasy players should look at players that way or they will find themselves with an unbalanced roster. What you will discover sooner or later is that most players regress to the mean.
I’m not a professional statistician and I didn’t stay at a Holiday Inn Express last night, but I have spent most of my spare time playing with numbers. What most sabermetricians have noticed through the years is that when you get closer to the mean you see many more points of data. In plain English, that means that the further you get from the top and bottom the closer each player comes to one another. You will notice that when looking at pitchers 11-20 than we did with the last list. That means that the relative value of each player is less because there are fewer runs separating them from the next available player. That is substitution value.
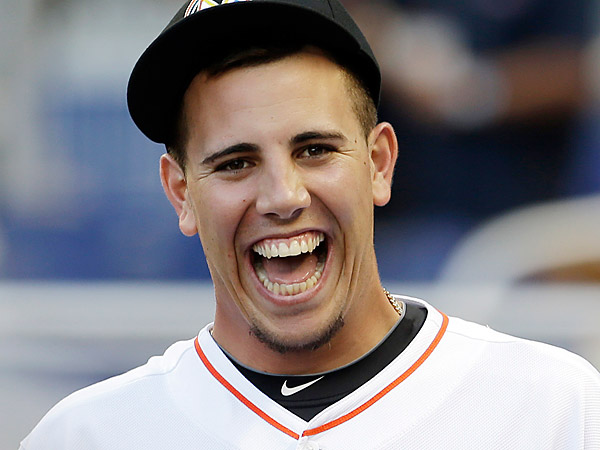
11. Jose Fernandez— Miami Marlins
2013: 27.1
3 Year: N/A
5 Year: N/A
I am extremely nervous when asked to forecast a first year player the next season. Every instinct tells me to expect a dip in production and yet Fernandez toiled for the worst team in the National League. If we split the difference we would come back to where he finished last season. He’ll likely get more wins with overall team improvement, but the other numbers may see a dip.
12. Anibal Sanchez— Detroit Tigers
2013: 42.0
3 Year: 26.4
5 Year: 20.8
The Tigers have been consistent contenders for the last several seasons, and while Dave Dombrowski certainly has his detractors, you have to give him credit for one thing: he understood that things needed to be shaken up. It remains to be seen whether the shake up will work in his favor, but when you look at TRI data across the board, you can see the Tigers likely wouldn’t have lasted as they were constructed. So, they get rid of one starting pitcher and Prince Fielder and replace them with a second baseman and closer. Sanchez is one of those players that likely won’t perform like he did last season, but he should still be solid.
13. Doug Fister— Washington Nationals
2013: 29.3
3 Year: 26.4
5 Year: 15.3
Yes, Drombowski saw that the team needed changing, but I’m not sold on those changes. I would rather have four starters among the top thirteen in baseball and a relatively unproven closer than three good starters and a dominant closer. Closers always sound much better when you are sitting around shooting the bull in the sports bar, but in the grand scheme of things you are better off with a deeper rotation. As for Fister, he should see a slight bump because he will be facing the starting pitcher in the batter’s box instead of a DH and Washington is a pretty decent pitcher’s ballpark.
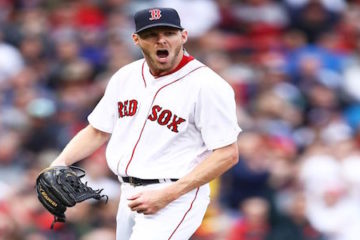
14. Chris Sale— Chicago White Sox
2013: 38.7
3 Year: 25.9
5 Year: N/A
Sale has relatively flown underneath the radar because the White Sox are not quite ready for prime time. They have a strong bullpen and they have added some bats to the lineup, so it will be interesting to see if that has any affect on arms like Sale. I would be perfectly comfortable with Sale on top of my rotation and he is yet another example of how little difference there is between the seventh or eighth best guy and the fourteenth of fifteenth best guy.
15. CC Sabathia— New York Yankees
2013: 1.9
3 Year: 25.9
5 Year: 32.3
Welcome to Exhibit B (Justin Verlander being Exhibit A) of how much trouble you can get in spending early picks on pitching. Sabathia had been a virtual lock to win close to twenty games every season along with solid numbers in the other categories. Sabathia simply had a down year and then went on the shelf late in the season. I would expect a bounce back, but he likely won’t bounce back to the top five where his five year numbers would indicate. He is probably a solid second starter at this point in his career.
16. James Shields— Kansas City Royals
2013: 26.5
3 Year: 25.2
5 Year: 19.4
When we look at James Shields we look at the poster child for the number one vs. ace pitcher debate. It’s always nice to get involved in such debates, but in the end it really doesn’t matter. It matters on Opening Day when Shields is matched up with the other team’s number one pitcher, but in the grueling summer months you just want a pitcher that will pitch deep into games and have a chance to win. In most seasons, he is among the league leaders in innings and so he gives you the relevant numbers by virtue of his volume.
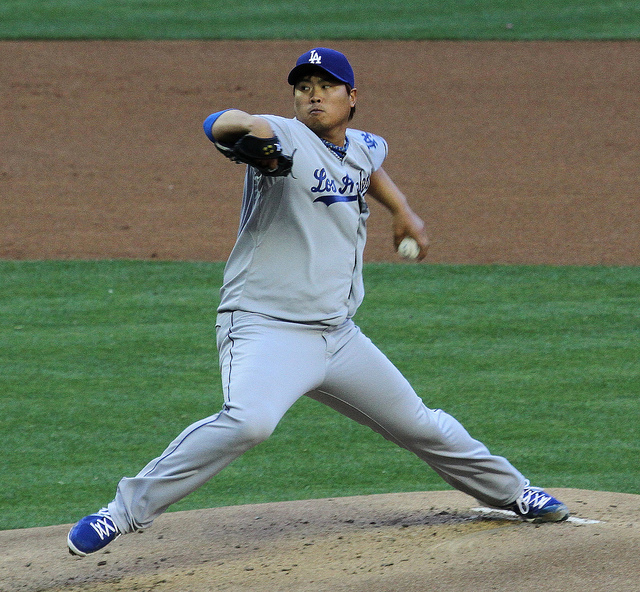
17. Jered Weaver— Los Angeles Angels
2013: 11.8
3 Year: 24.1
5 Year: 28.4
I’m really worried about Weaver. If you look at the pitch f/x data you will see why his numbers have been dipping lately. His velocity is down and he hasn’t been missing as many bats as he once did. His basic fantasy stats haven’t reflected this yet, but they undoubtedly will. Even if he produces as he did in 2013 (but over a full season) he will still be a solid fantasy prospect, but some people will bid on him as if he is still a top ten guy. If they want to go there then let them. There will be better arms available to you in that scenario.
18. Ubaldo Jimenez— Cleveland Indians (FA)
2013: 17.1
3 Year: 6.7
5 Year: 21.2
Jimenez is one of those pitchers where you simply have to make your best guess. The three year data shows a very ordinary pitcher, but he had a good year last year and the five year data represents a continuance of that. Naturally, a lot of where he will go in fantasy drafts indicates where he will go in real life. Cleveland is a good home for him, but others could be even better. This bears watching.
19. Josh Johnson— San Diego Padres
2013: -10.8
3 Year: 4.0
5 Year: 20.4
2013 was an outlier in every sense of the word. In terms of TRI data, his 2013 season drug everything down. The question is whether it is the beginning of the end or simply a hiccup. This is where looking at the so-called sabermetric numbers can help. His FIP, HR/FB%, and BABIP all indicate that he suffered through some bad luck. Furthermore, a move to Petco Park will naturally drive all of those numbers down by itself. The end result could be the bargain of the 2014 draft.
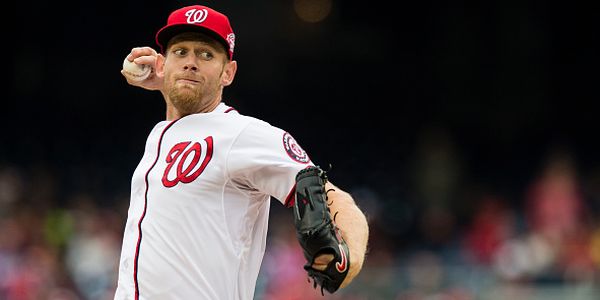
20. Jordan Zimmermann— Washington Nationals
2013: 19.5
3 Year: 19.7
5 Year: 10.0
No one would have figured that Zimmermann and Fister would be the first two National starters on the board, but here we are seeing the difference between hype and production. There is no doubt that the other two might be more talented, but talent doesn’t win you fantasy titles (or real ones). Production wins those for you and Zimmermann is the more productive arm from that staff. Try to remember that on draft day when people are going nuts over Stephen Strasburg.