
2018 Fantasy Baseball: Top Ten Fantasy Left Fielders
There are a number of ways to approach fantasy outfielders. Some platforms consider all outfielders one and the same. Analyzing outfielders in that world is easy enough. Still others consider them in their separate positions. I’ve always approached it with the thinking that is easier to consider them by position and then adjust to the looser format then to consider them all the same and then scramble to rank them by specific position.
Left fielders present a problem in that there are no dominant left fielders. There are quite a few dominant center fielders and right fielders. It’s just a peculiarity of the position. So, picking a top left fielder or even a top five is a lot like putting makeup on a pig. One fan will look at the list and nod in agreement while most will scratch their head and wonder what in the heck I am thinking. I acknowledge that going in.
Some of you may not be familiar with total points. It is primarily use by daily fantasy leagues, but since that is a multi-billion dollar industry we thought we should include it to help more of our readers. Some season long leagues are including the format as well. We are including our own formula below because almost every platform has their own version. Choosing one over the other seems unfair. We also are including their aggregate numbers over the past five years, career per 162 data, and Steamer projections. All of this was included in the selections of the top ten and top 20.
Total Points = Total Bases + Runs + RBI + SB + HBP – SO – CS – GIDP
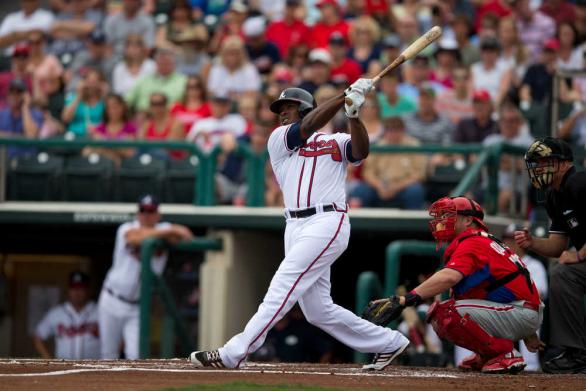
Justin Upton—Los Angeles Angels
| G | TP | Rank | TP/G | Rank | |
| 2017 | 152 | 407 | 2.68 | ||
| 2016 | 153 | 298 | 1.95 | ||
| 2015 | 150 | 329 | 2.19 | ||
| 2014 | 154 | 346 | 2.25 | ||
| 2013 | 149 | 337 | 2.26 | ||
| AVG | 152 | 343 | 2 | 2.26 | 8 |
Aggregate: .261, 30 HR, 87 Runs, 90 RBI, 12 SB, 65 BB 5 Category: 1
Per 162: .269, 28 HR, 95 Runs, 88 RBI, 15 SB, 69 BB 6 Category: 1
Steamer: .247, 29 HR, 79 Runs, 87 RBI, 11 SB, 64 BB DRS: +8
Upton was the number one overall pick in the draft. From that point on a lot was expected and he always seems to slide a shade under those lofty expectations. Finding him number one here is more an indictment on the position than an endorsement of him. He’s been extremely durable and contributes good numbers in five of the six major categories. Heavy strikeouts make him an overrated play in total points.
Yoenis Cespedes—New York Mets
| G | TP | Rank | TP/G | Rank | |
| 2017 | 81 | 204 | 2.52 | ||
| 2016 | 132 | 350 | 2.65 | ||
| 2015 | 159 | 434 | 2.73 | ||
| 2014 | 152 | 361 | 2.38 | ||
| 2013 | 135 | 285 | 2.11 | ||
| AVG | 132 | 327 | 5 | 2.48 | 3 |
Aggregate: .273, 26 HR, 76 Runs, 83 RBI, 5 SB, 36 BB 5 Category: 3
Per 162: .274, 32 HR, 93 Runs, 102 RBI, 8 SB, 46 BB 6 Category: 7
Steamer: .271, 33 HR, 81 Runs, 93 RBI, 3 SB, 48 BB DRS: +6
Cespedes is the most talented guy on the board and he has the biggest upside, but he seems to have adopted the Mets curse of flashing dominance and then getting hurt. Picking him number two here is a bit of a risk, but with an underwhelming pool of competitors it seemed a fairly easy risk to take. Steamer seems to agree, so hopefully there is strength in numbers.
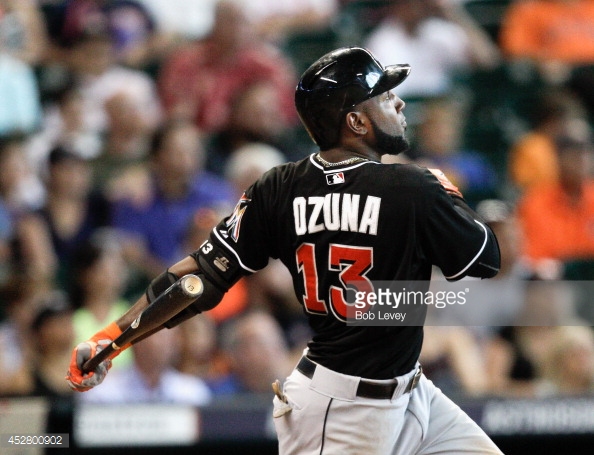
Marcell Ozuna—St. Louis Cardinals
| G | TP | Rank | TP/G | Rank | |
| 2017 | 159 | 453 | 2.85 | ||
| 2016 | 148 | 321 | 2.17 | ||
| 2015 | 123 | 179 | 1.46 | ||
| 2014 | 153 | 282 | 1.84 | ||
| 2013 | 70 | 126 | 1.80 | ||
| AVG | 131 | 272 | 11 | 2.08 | 16 |
Aggregate: .274, 19 HR, 64 Runs, 72 RBI, 2 SB, 38 BB 5 Category: 14
Per 162: .277, 24 HR, 79 Runs, 90 RBI, 3 SB, 47 BB 6 Category: 14
Steamer: .291, 29 HR, 78 Runs, 93 RBI, 2 SB, 50 BB DRS: +10
Financial advisors will tell you that past results are no guarantee for future performance. Fans that live and die by numbers rely on past results to inform their decisions. This is where we ask ourselves which past results to pay attention to. The aggregate when extrapolated out to 150 games closely mirrors Steamer. There is a reason for that. Are 2016 and 2017 more relevant than the rest of his career? If so, then he might be the best guy on the board.
Ryan Braun—Milwaukee Brewers
| G | TP | Rank | TP/G | Rank | |
| 2017 | 104 | 253 | 2.43 | ||
| 2016 | 135 | 389 | 2.88 | ||
| 2015 | 140 | 366 | 2.61 | ||
| 2014 | 135 | 312 | 2.31 | ||
| 2013 | 61 | 142 | 2.33 | ||
| AVG | 115 | 292 | 8 | 2.54 | 2 |
Aggregate: .284, 20 HR, 65 Runs, 69 RBI, 13 SB, 41 BB 5 Category: 6
Per 162: .302, 34 HR, 104 Runs, 110 RBI, 21 SB, 57 BB 6 Category: 3
Steamer: .276, 27 HR, 77 Runs, 84 RBI, 13 SB, 51 BB DRS: -5
Real people are never as good or evil as they may appear. Braun was a scumbag who lied about his PED use, but at some point, everyone has the capacity of redemption. That was five years ago and the numbers here represent a complete reboot. He’s always been good, but this latest reiteration hasn’t been as healthy or productive. The per 162 includes those juice enhanced years, so the Steamer is much more relevant.
Michael Brantley—Cleveland Indians
| G | TP | Rank | TP/G | Rank | |
| 2017 | 90 | 234 | 2.60 | ||
| 2016 | N/A | N/A | N/A | ||
| 2015 | 137 | 417 | 3.04 | ||
| 2014 | 156 | 510 | 3.27 | ||
| 2013 | 151 | 338 | 2.24 | ||
| AVG | 134 | 375 | 1 | 2.80 | 1 |
Aggregate: .305, 14 HR, 69 Runs, 77 RBI, 17 SB, 46 BB 5 Category: 2
Per 162: .292, 12 HR, 81 Runs, 81 RBI, 19 SB, 54 BB 6 Category: 2
Steamer: .292, 16 HR, 68 Runs, 72 RBI, 10 SB, 49 BB DRS: +4
In the movie “The Rookie,” the scout that signed Jim Morris told him that if he turned in a 38 year old to his bosses they would laugh him out of the room. If he didn’t turn in a 98 MPH fastball he’d be fired. It’s hard to get fired from this job, but failing to put the best left fielder according to the rankings in the top five seems like an offense that should get you terminated. Putting him in the top five might lead to laughter and ridicule. You really can’t win here.
Starling Marte—Pittsburgh Pirates
| G | TP | Rank | TP/G | Rank | |
| 2017 | 77 | 173 | 2.25 | ||
| 2016 | 129 | 302 | 2.34 | ||
| 2015 | 153 | 351 | 2.29 | ||
| 2014 | 135 | 286 | 2.12 | ||
| 2013 | 135 | 274 | 2.03 | ||
| AVG | 277 | 9 | 2.20 | 9 |
Aggregate: .289, 12 HR, 72 Runs, 50 RBI, 34 SB, 26 BB 5 Category: 8
Per 162: .288, 16 HR, 90 Runs, 64 RBI, 43 SB, 33 BB 6 Category: 11
Steamer: .287, 16 HR, 75 Runs, 68 RBI, 30 SB, 33 BB DRS: +8
Total points has a way of distilling out the crap and leaving you with an accurate view of every player. Stolen bases is a relatively difficult category to fulfill, so everyone that offers stolen bases is overvalued. Much like closers, we curse them and deride them and then end up picking them earlier than we want. Marte is the same. He rests here comfortably near the top five even if the rest of his game doesn’t warrant it.
Khris Davis—Oakland Athletics
| G | TP | Rank | TP/G | Rank | |
| 2017 | 153 | 368 | 2.41 | ||
| 2016 | 150 | 342 | 2.28 | ||
| 2015 | 121 | 236 | 1.95 | ||
| 2014 | 144 | 279 | 1.94 | ||
| 2013 | 56 | 116 | 2.07 | ||
| AVG | 125 | 268 | 14 | 2.14 | 12 |
Aggregate: .253, 29 HR, 65 Runs, 75 RBI, 4 SB, 40 BB 5 Category: 11
Per 162: .248, 38 HR, 85 Runs, 97 RBI, 5 SB, 52 BB 6 Category: 9
Steamer: .242, 36 HR, 82 Runs, 98 RBI, 3 SB, 58 BB DRS: -13
Davis might be a mirror image of Marte. He gives you four strong categories, but some dismiss him because of the low batting average and lack of speed. Elite power is not as rare as elite speed, but it is elite for a reason. He’s averaged over 40 home runs over the past two seasons. There is no reason that shouldn’t continue and if he ever gets traded it will be worth considerably more.
Brett Gardner—New York Yankees
| G | TP | Rank | TP/G | Rank | |
| 2017 | 151 | 385 | 2.55 | ||
| 2016 | 148 | 297 | 2.01 | ||
| 2015 | 151 | 334 | 2.21 | ||
| 2014 | 148 | 320 | 2.16 | ||
| 2013 | 145 | 298 | 2.06 | ||
| AVG | 149 | 327 | 6 | 2.19 | 10 |
Aggregate: .263, 14 HR, 88 Runs, 56 RBI, 21 SB, 64 BB 5 Category: 10
Per 162: .264, 11 HR, 92 Runs, 54 RBI, 32 SB, 66 BB 6 Category: 6
Steamer: .260, 16 HR, 81 Runs, 59 RBI, 15 SB, 62 DRS: +20
Gardner is the type of player a seamhead proudly drafts in a five category league and ends up getting buried. His value is hidden behind a healthy walk rate and a true Gold Glove caliber glove. Neither of those show up in traditional formats, but total point encompasses more of what he does well (except the fielding). So, plan accordingly. If you are fortunate to play in one of the newer formats he could be a very good pick.
Adam Duvall—Cincinnati Reds
| G | TP | Rank | TP/G | Rank | |
| 2017 | 157 | 329 | 2.10 | ||
| 2016 | 150 | 340 | 2.27 | ||
| AVG | 154 | 335 | 3 | 2.18 | 11 |
Aggregate: .245, 32 HR, 82 Runs, 101 RBI, 6 SB, 40 BB 5 Category: 5
Per 162: .241. 32 HR, 79 Runs, 97 RBI, 5 SB, 40 BB 6 Category: 5
Steamer: .232, 28 HR, 66 Runs, 83 RBI, 5 SB, 38 BB DRS: +8
Rosterresource.com has Duvall currently as the fourth outfielder, but we will put Duvall here and assume the Reds don’t intend to bench someone that has averaged 100 RBI over the past two seasons. Billy Hamilton looks to be playing elsewhere as the Reds want to make room for Jesse Winker somewhere in their outfield.
Andrew Benintendi—Boston Red Sox
| G | TP | Rank | TP/G | Rank | |
| 2017 | 151 | 380 | 2.52 | ||
| 2016 | 34 | 66 | 1.94 | ||
| AVG | 93 | 223 | 23 | 2.40 | 5 |
Aggregate: .283, 11 HR, 50 Runs, 52 RBI, 11 SB, 40 BB 5 Category: 20
Per 162: .274, 19 HR, 88 Runs, 91 RBI, 18 SB, 70 BB 6 Category: 18
Steamer: .286, 20 HR, 85 Runs, 82 RBI, 16 SB, 62 BB DRS: +7
People that want to put Benintendi in the top five are welcome to. There is enough here to project that he will be that type of player. Unfortunately, he has had only one full season in the big leagues. I’ve always felt a bit squeamish about projecting someone that high following only one season. Still, he gives you a little bit of everything and he has few glaring negatives, so he will likely shoot up the board following this season.

2 Comments
You better fix this ranking and add Bellinger at #1 and Hoskins at #2
Bellinger and Hoskins both profiled as first basemen as they played more games there in 2017 than in left. They were featured prominently in those articles. In order to profile more players, I have kept players at their primary position. However, if you’d like to consider them there, depending on the platform, you would be perfectly defensible in doing so.