
2019 Fantasy Baseball: Final Shortstop Rankings
We are moving immediately into awards season. These couple of weeks where Rookie of the Year, Manager of the Year, MVP, Cy Young, and Gold Gloves are awarded just serves to whet our appetite for the Hot Stove season. Of course, this is the perfect time for web sites like ours to release our own rankings for each position. We inevitably use six categories, total points, and points per game to determine our rankings.
The cross-section helps you depending on the format you use and probably inspires some debate in the process. In addition to ranking in those three areas, we also took the positional average of everyone that played shortstop and had 300 or more plate appearances. When they are above average the font will be green. When they are below average the font will be red.
Average: .272/18 HR/73 Runs/66 RBI/11 SB/39 BB
Total Points= Total Bases + Runs + RBI + SB + BB + HBP – SO – CS- GIDP
Marcus Semien—Oakland Athletics
Six Categories: .285/33/123/92/10/87 (1st)
Total Points: 536 (1st)
Points Per Game: 3.31 (2nd)
Semien represents the tug of war between focusing on tools and focusing on production. He doesn’t have top end speed or top end power, but he does enough of both to be productive. I seriously doubt he will be a fantasy first round pick, but he was good enough to be an MVP finalist. Eventually, you ignore the hype and just go with the numbers. He has the numbers.
Xander Bogaerts—Boston Red Sox
Six Categories: .309/33/110/117/4/76 (3rd)
Total Points: 515 (2nd)
Points Per Game: 3.32 (1st)
The main draw of total points is that it is an objective way to look at numbers. If you compare the basic numbers it can be hard to choose between Bogaerts and Semien. Total points helps may that call for you. Since runs and RBI are major parts of the formula, it isn’t a pure test of who the actual best player is. Bogaerts obviously has an advantage playing for a better offense, but that’s a part of the calculus.
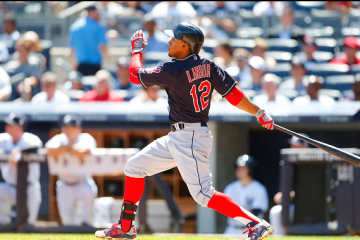
Francisco Lindor—Cleveland Indians
Six Categories: .284/32/101/74/22/46 (4th)
Total Points: 440 (3rd)
Points Per Game: 3.08 (3rd)
Hot stove season is always fun for speculation and there is speculation that the Indians might move Lindor. He will probably be too expensive for them to keep and they could get a good haul for him. That obviously changes his future value. These rankings are all about past value.
Trevor Story—Colorado Rockies
Six Categories: .294/35/111/85/23/58 (2nd)
Total Points: 425 (5th)
Points Per Game: 2.93 (5th)
The Rockies have three top five players at their position. When you put them together they make quite an offensive attack. They’ve spent the past few seasons trying to find that fourth guy and have come up short. That might be Brendan Rogers. Maybe Daniel Murphy comes back and is healthy. Maybe David Dahl finally steps up. Either way, he is just a tad behind the top three.
Trea Turner—Washington Nationals
Six Categories: .298/19/96/57/35/43 (7th)
Total Points: 365 (6th)
Points Per Game: 2.99 (4th)
It isn’t so much that there is a World Series hangover. It’s more than success tends to blur our expectations. Turner has had exactly one healthy season. The residuals on that season still get him overdrafted in full season leagues. He’s a nice play in daily fantasy leagues, but it’s also fair to ask what the Nationals will look like if Anthony Rendon chases the money.
Jorge Polanco—Minnesota Twins
Six Categories: .295/22/107/79/4/60 (5th)
Total Points: 430 (4th)
Points Per Game: 2.81 (8th)
The Twins hit more dingers than any team has in history. Yet, they face the same problem as most middle market teams. They need more to compete with the big boys, but they will be doing good to maintain. They will need guys like Polanco to continue to overachieve. It remains to be seen if he can repeat this performance.
Corey Seager—Los Angeles Dodgers
Six Categories: .272/19/82/87/1/44 (12th)
Total Points: 348 (8th)
Points Per Game: 2.60 (9th)
Is Seager injury prone? He had one horrific knee injury and some bumps and bruises that key him out last season. He was totally healthy in 2017. I’m not sure two seasons are enough to consider that a pattern. If you gave him a full slate of games he would have come closer to 25 homers and 100 runs and RBI. We just don’t know if we can count on health.
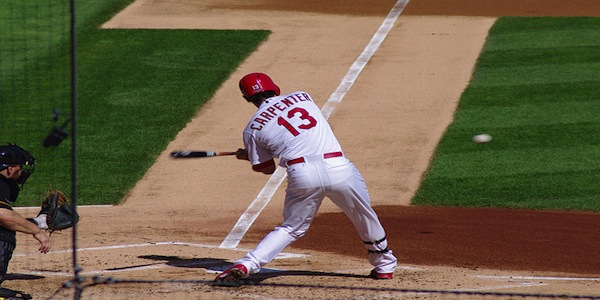
Paul Dejong—St. Louis Cardinals
Six Categories: .233/30/97/78/9/62 (8th)
Total Points: 349 (7th)
Points Per Game: 2.19 (16th)
It’s pretty impressive for everyone at the position (the top 15) to average more than two points per game. We don’t see that at most spots. Dejong is not a remarkable player. Most of the Cardinals aren’t. What they are is a group of players that were good enough to win a division and get to the NLCS.
Jean Segura—Philadelphia Phillies
Six Categories: .280/12/79/60/10/30 (10th)
Total Points: 348 (8th)
Points Per Game: 2.42 (13th)
Segura is on his fifth team. Usually guys get a label when they have been on this many teams. We aren’t in the clubhouse with Segura so we have no idea if that is the issue. It is probably more about him being occasionally great, but usually just pretty good. Maybe he’s wearing out his welcome with random precision.
Fernando Tatis Jr.—San Diego Padres
Six Categories: .317/22/61/53/16/30 (11th)
Total Points: 242 (18th)
Points Per Game: 2.88 (6th)
This is one of those instances where the points per game is a lot closer to reality and even then, it might not be quite enough. Tatis had an outside shot of finishing 30/30 before his season ended prematurely. The Padres have talent coming out of their ears, so it will be really exciting to see what that roster looks like in a couple of years.
Javier Baez—Chicago Cubs
Six Categories: .281/29/89/85/11/28 (6th)
Total Points: 316 (14th)
Points Per Game: 2.29 (15th)
Baez is a top five player in five category leagues. The lack of plate discipline is the real issue. In formats that consider it (walks, strikeouts) you start the see the shine come off. He was a finalist for the MVP in 2018, so it’s difficult ranking him this low, but those strikeouts are just impossible to ignore.
Tim Anderson—Chicago White Sox
Six Categories: .335/18/81/56/17/15 (9th)
Total Points: 299 (15th)
Points Per Game: 2.43 (12th)
There is the old, tried and true expression that we don’t know how Anderson will make it to the awards podium because he sure won’t walk. Anderson is a nice play in five category formats where his power and speed plays up, but lack of plate discipline makes him difficult to use in more sophisticated formats.
Elvis Andrus—Free Agent*
Six Categories: .275/12/81/72/31/34 (15th)
Total Points: 340 (10th)
Points Per Game: 2.31 (14th)
Andrus officially has an option to become a free agent. He could very well return to Texas because there isn’t much of a market out there. He’s younger then you think, but he has seemingly been around forever and players that build their game around speed don’t have much of a shelf life.
Nick Ahmed—Arizona Diamondbacks
Six Categories: .254/19/79/82/8/52 (13th)
Total Points: 338 (11th)
Points Per Game: 2.14 (18th)
Coming into the season, Ahmed wouldn’t even have broken a top 20 list of shortstops. It pays to pay attention to the waiver wire. He didn’t start as a fantasy regular, but he certainly ended as one. Growth is rarely linear, so it’s hard to say where he goes from here, but it certainly would make sense to keep an eye on him to see how far he tumbles down the draft board.
Carlos Correa—Houston Astros
Six Categories: .279/21/42/59/1/35 (17th)
Total Points: 215 (19th)
Points Per Game: 2.87 (7th)
As an Astros fan I find Correa to be infuriating. He teases you when he is completely healthy and makes you think he could be an MVP candidate if he ever played 150 games. He could be a trade candidate this winter. The arbitration numbers will be considerable and you just can’t count on him to play more than 120 games.
