
2021 Fantasy Baseball: Top Ten Fantasy Third Basemen
There are any number of formats we could evaluate, but my personal favorite has always been total points. It has a number of advantages. First, it is a growing format in that daily fantasy sites use it exclusively (although they may have different formulas). Secondly, it apportions an appropriate weight per event. In other words, it doesn’t overemphasize any event over another based on perceived scarcity. Third base sees more significance than other positions because stolen bases are given way too much weight.
The third and final advantage is that it allows you to compare players from different positions because it tells how much better one player is than another. This can help not only with positional rankings, but overall rankings as well. It helps to know the relative depth of a position when making those rankings. Third base could be the deepest position on the diamond, so understanding the difference between players is more important than having an absolute ranking.
We will look at the top ten third basemen for the coming year according to two metrics. The first is total points over the past five seasons and the second is points per game. Generally speaking, the more data you have the better off you are and that is particularly true given the abbreviated nature of the 2020 season. We will also include a projection from baseball-reference for the 2021 season.
Total Points= TB + Runs + RBI + BB + SB + HBP – SO – CS- GIDP
Jose Ramirez–Cleveland Indians
Games: 648
Points: 2116 (2nd)
PPG: 3.27 (1st)
Projection: .260/30 HR/87 Runs/91 RBI/23 SB
Will the last guy out of Cleveland turn the lights out? They did resign Cesar Hernandez and they still have Franmil Reyes, but they’ve lost Francisco Lindor and Carlos Santana. So, run scoring opportunities might be fewer and further between. He still should produce 20/20 numbers, so he will be valuable no matter what format you are playing in.
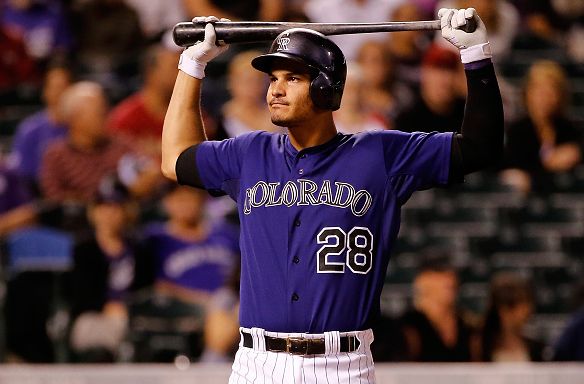
Nolan Arenado–Colorado Rockies
Games: 678
Points: 2197 (1st)
PPG: 3.24 (2nd)
Projection: .284/28 HR/77 Runs/85 RBI/3 SB
My guess is that BR is projecting him wearing another uniform. If he leaves Coors he immediately might tumble out of the top five, so this ranking assumes he stays in Denver. He’s produced 110 or more RBI five seasons in a row not counting 2020. He produced five or more wins in each of those five seasons due to his bat and glove. If he moves he makes another team an immediate contender.
Anthony Rendon–Los Angeles Angels
Games: 637
Points: 2015 (3rd)
PPG: 3.16 (3rd)
Projection: .291/25 HR/88 Runs/93 RBI/4 SB
The main difference between Rendon and the top two guys is playing time. Those two are locks to play 150 or more games where Rendon is a little more shaky. He’s only surpassed that total once in his career and he wasn’t likely to do it last season either had it been a full season. Rendon and Trout make a nice one-two punch, but they will need help on top of that to compete.
Alex Bregman–Houston Astros
Games: 559
Points: 1758 (5th)
PPG: 3.14 (4th)
Projection: .277/25 HR/78 Runs/76 RBI/5 SB
Bregman comes with many layers. One layer has the fact that he is eligible at short in most leagues. That obviously raises his fantasy profile. The second layer adds in the fact that he has one of the higher OBPs in the game. Based on those two factors alone I’d bump him up to second or third. However, he did have a down year in 2020 and some would claim that might be the hangover from the sign stealing scandal. I tend to think it was just an off season, but some might read more into that.
Manny Machado–San Diego Padres
Games: 691
Points: 1900 (4th)
PPG: 2.75 (8th)
Projection: .271/31 HR/80 Runs/88 RBI/9 SB
There are those that considered Machado to be the most deserving MVP last year in the National League. If you look at from the standpoint of who meant more to his team you could make a compelling argument. There are others that have slightly better numbers here, but a large part of this is about projecting these players moving forward and he is in the prime of his career and in a great young lineup.
Kris Bryant–Chicago Cubs
Games: 589
Points: 1650 (6th)
PPG: 2.80 (6th)
Projection: .258/18 HR/68 Runs/53 RBI/3 SB
2020 was a struggle, but let’s consider the circumstances. Not only did he have to deal with COVID, but right before the season he had a hearing to determine whether he would be a free agent in 2021 or 2022. He lost that hearing. Add in all of those factors and its easy to see how he could lose focus. He might be dealt before the season starts or during the season. Either way, he will be a free agent in 2022, so I imagine he is motivated to do better than what you see above.
Rafael Devers– Boston Red Sox
Games: 392
Points: 1016 (16th)
PPG: 2.59 (9th)
Projection: .277/27 HR/93 Runs/95 RBI/6 SB
Total points doesn’t like Devers as much because he doesn’t walk much and strikes out a little too often. Yet, his performance last season is more impressive than what it looks. There was no Mookie Betts and J.D. Martinez went in the tank. Yet, Devers managed to perform credibly even if the numbers were spectacular. Something tells me Boston will be better again and so will Devers.
Josh Donaldson–Minnesota Twins
Games: 503
Points: 1451 (10th)
PPG: 2.88 (5th)
Projection: .241/19 HR/55 Runs/51 RBI/3 SB
The projections look awful for Donaldson, but he has never been this bad in a full season. His problem has always been health. When he’s played in more than 120 games he has always been one of the best all-around third basemen in the game. Minnesota is still one of the better offenses in all of baseball and this season should be no different. I’d bet the over.
Matt Chapman–Oakland Athletics
Games: 422
Points: 990 (17th)
PPG: 2.35 (12th)
Projection: .252/23 HR/71 Runs/62 RBI/2 SB
Yes, he missed time last season, but averaged 150 games in his first two full seasons. So, I’m not exactly sold on this projection. If you give him 100 or so more plate appearances then it turns in nearly 30 home runs, 90 runs scored, and 80 RBI. That seems to be more in line with what he produced in 2018 and 2019.
Eugenio Suarez–Cincinnati Reds
Games: 674
Points: 1517 (9th)
PPG: 2.25 (14th)
Projection: .253/35 HR/75 Runs/90 RBI/3 SB
Again, this is a question of how much stock you put into last season. He still would have hit between 30 and 40 home runs in a full season. Anytime anyone can produce that kind of power he will have value. He has two consecutive 100+ RBI campaigns in a row in his last two full seasons. There’s obviously something here that allows him to leapfrog some of the guys above him on the total points list.