
The Hall of Fame Index: Chase Utley
Hopefully, this is not the first Hall of Fame Index article you are taking in. However, for some this is your first, so I should go through the parameters of what we are doing before diving into the second base pool. Second base is the most intriguing position in terms of the Hall of Fame because there is a genuine debate over who the best second baseman in history is. The index does not officially weigh in on that debate, but we can use it as a tool for the truth.
To put it simply, I wanted to find a way to simultaneously compare players of varying styles and varying eras without having their specific counting numbers prejudice the process. One cannot look at a Rogers Hornsby and compare him to Joe Morgan in any real way unless we find a method to distill out the differences in the era they played in or the parks they called home. The 1970s and 1920s couldn’t be more different. However, we can compare the value they brought to their teams and that is where WAR comes in generally and the index comes in more specifically.
The Hall of Fame Index takes the WAR scores from three different reputable sources (Baseball Reference, Baseball Prospectus, and Fangraphs) and adds them up for one score. The index has a basic career value component and adds in a peak value component comprised of the player’s best ten year stretch. We combine those elements to come up with the index. For those interested in a much more in depth look at the Hall of Fame can follow the link above for the book version. There, I look at the BBWAA selections, Veterans Committee selections, those on the outside looking in, and current players. In this article, we will look at the BBWAA selections and one current player.
Career Value
| BR | BP | FG | Total | |
| Rogers Hornsby | 127.0 | 128.6 | 130.3 | 385.9 |
| Eddie Collins | 123.9 | 122.2 | 120.5 | 366.6 |
| Nap Lajoie | 107.4 | 104.8 | 102.2 | 314.4 |
| Joe Morgan | 100.3 | 97.9 | 98.8 | 297.0 |
| Charlie Gehringer | 80.6 | 79.6 | 78.6 | 238.8 |
| Rod Carew | 81.1 | 72.1 | 72.3 | 225.5 |
| Frankie Frisch | 70.4 | 72.6 | 74.8 | 217.8 |
| Craig Biggio | 65.1 | 60.2 | 65.8 | 191.1 |
| Roberto Alomar | 66.8 | 59.8 | 63.6 | 190.2 |
| Ryne Sandberg | 67.5 | 59.1 | 60.9 | 187.5 |
| Jackie Robinson | 61.5 | 59.4 | 57.2 | 178.1 |
| Chase Utley | 63.8 | 55.3 | 62.7 | 181.8 |
The index splits the Hall of Fame into three distinctive groups. The top four players distant themselves quite a bit and you will get some disagreement about the ordering, but every expert agrees those are the top four guys. The upshot is that each brought unique talents that added up to fairly similar value. Collins excelled in what would be known as inside baseball. He spent most of his prime in the Dead Ball Era where home runs were rare and speed and defense were highly valued. Hornsby was the exact opposite. Hornsby’s counting numbers obviously were far superior, but the relative value ended up being similar.
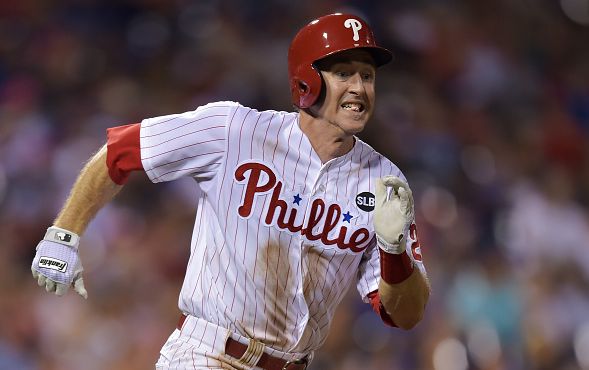
This brings us to Chase Utley. When looking at the basic numbers you wouldn’t think he belonged in the Hall of Fame. If you have read the other articles you know the importance of being what I would call a two-way player. Utley has not won any Gold Gloves, but during a six year stretch he had 1.6 dWAR or more. He led the league for all defensive players in that category in 2008. During those previously mentioned six seasons, he had twelve or more defensive runs saved (Fielding Bible) and finished in the top three in all of baseball amongst second basemen in five of those six seasons. To make a long story short, he was a legit elite fielding second baseman during his prime to go along with being a very good offensive player. Of course, that will be seen when we look at the peak value numbers.
Peak Value
| BR | BP | FG | Total | |
| Rogers Hornsby | 93.1 | 95.1 | 97.1 | 285.3 |
| Eddie Collins | 78.1 | 77.1 | 76.1 | 231.3 |
| Nap Lajoie | 74.9 | 73.6 | 72.2 | 220.7 |
| Joe Morgan | 67.8 | 65.4 | 67.0 | 200.2 |
| Charlie Gehringer | 61.5 | 60.6 | 59.6 | 181.7 |
| Jackie Robinson | 61.5 | 59.4 | 57.2 | 178.1 |
| Frankie Frisch | 55.6 | 57.3 | 59.1 | 172.0 |
| Rod Carew | 59.1 | 52.2 | 52.5 | 163.8 |
| Ryne Sandberg | 56.5 | 50.9 | 51.6 | 159.0 |
| Craig Biggio | 53.1 | 45.8 | 51.3 | 150.2 |
| Roberto Alomar | 50.3 | 46.9 | 47.5 | 144.7 |
| Chase Utley | 59.4 | 51.1 | 59.3 | 169.8 |
When you think about how fielding works and how it has been evaluated in the past you can’t help but shake your head. The traditional view of fielding involved a mixture of counting web gems with looking at fielding percentage. So, we grade fielding based on how spectacular a play looked in concert with whether someone thought they didn’t make a play they should have made.
Imagine if offense was graded that way. Instead, offense comes down to how often a hitter experiences success. In recent years, we have been able to approximate a fielder’s contribution to his team’s success or failure in getting outs. The numbers above reflect that there is not universal agreement in how to do that exactly, but at least we have gotten out of the dark ages of watching ESPN and looking at errors. Now, we are counting how often a fielder succeeds against the number of legitimate opportunities they get. It is the latter where we have some room to grow.
I bring this up as a point of comparison between a player like Utley and Roberto Alomar. Alomar had the reputation of being a brilliant defender back in the bad old days when defense was graded on how spectacular a player looked while fielding the position. Grading fielders was akin to grading gymnasts or figure skaters. Sure, there were technical elements, but it was also based a great deal on style. The truly great fielders make it look easy and therefore don’t make a ton of athletic looking plays. Occasionally, glitz meets greatness, but those examples are few and far between.
The Hall of Fame Index
| Career | Peak | Total | |
| Rogers Hornsby | 385.9 | 285.3 | 671.2 |
| Eddie Collins | 366.6 | 231.3 | 597.9 |
| Nap Lajoie | 314.4 | 220.7 | 535.1 |
| Joe Morgan | 297.0 | 200.2 | 497.2 |
| Charlie Gehringer | 238.8 | 181.7 | 420.5 |
| Frankie Frisch | 217.8 | 172.0 | 389.8 |
| Rod Carew | 225.5 | 163.8 | 389.3 |
| Jackie Robinson | 178.1 | 178.1 | 356.2 |
| Ryne Sandberg | 187.5 | 159.0 | 346.5 |
| Craig Biggio | 191.1 | 150.2 | 341.3 |
| Roberto Alomar | 190.2 | 144.7 | 334.9 |
| Chase Utley | 181.8 | 169.8 | 351.6 |
Utley has clearly qualified for the Hall of Fame when compared to this bunch. For those following the series, this is the first position where all of the members voted in by the BBWAA have met the standard according to the index. When you look at the numbers put up by the bottom four Hall of Famers it is hard to imagine Utley being in, but during his prime he was legitimately amongst the top five players in the National League.