
The Hall of Fame Index: What about Ken Boyer
When you think of third basemen and the Hall of Fame, the vast majority of those on the outside looking in come from the Expansion Era or the 1970s and 1980s more specifically. However, the Veterans Committee vote will consist of players that played between 1950 and 1969. We looked at Dick Allen last time, but there is one name that was a glaring omission from that comparison. That is because we were saving him for this time around.
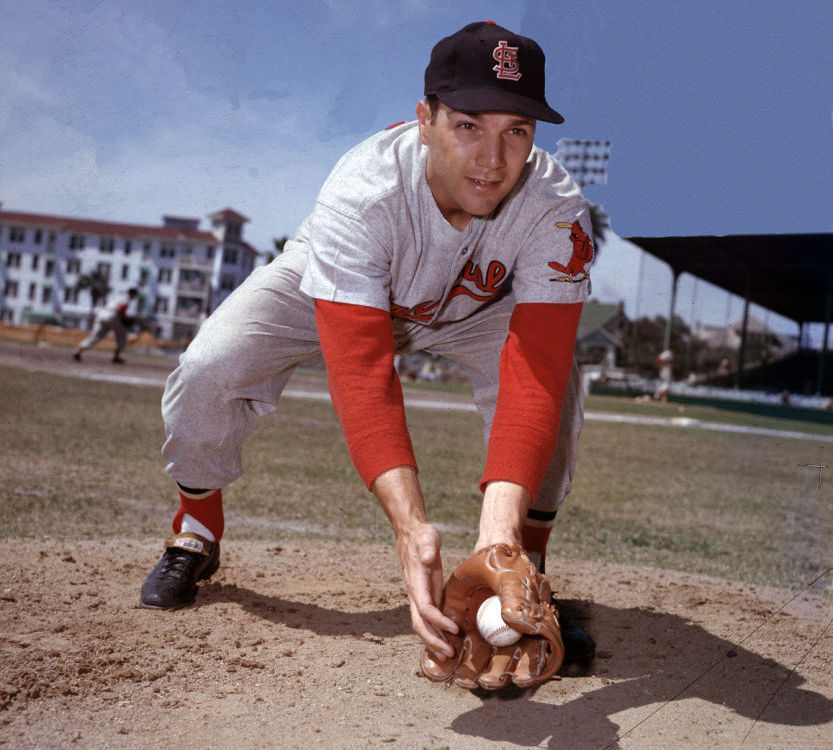
A large part of the bias surrounding Hall of Fame voting is whether the player in question looks like a Hall of Famer. In this case, does he fit the mold of what we would expect a third baseman to look like? In the case of Allen that might be doubtful. In the case of our player here, he more closely resembles the look of a typical third baseman.
Career Value
| BWAR | FWAR | WS/5 | Total | |
| Graig Nettles | 68.0 | 65.7 | 64.2 | 197.9 |
| Buddy Bell | 66.3 | 61.7 | 60.2 | 188.2 |
| Frank Baker | 62.7 | 60.1 | 60.2 | 183.0 |
| Sal Bando | 61.5 | 56.2 | 56.6 | 174.3 |
| Ken Boyer | 62.9 | 54.8 | 55.8 | 173.5 |
One could credibly argue that Nettles and Bell are the most qualified guys here, but in the infinite wisdom of the Veterans Committee and Hall of Fame, they are not eligible under the rules. The only player eligible here is Boyer. There are a number of folks that think Boyer should be in the Hall of Fame. Only Baker is in the Hall of Fame on this list, but that doesn’t necessarily mean anything. All five players have solid credentials and are already superior to some players in.
Boyer will almost certainly be one of the ten finalists on the ballot, so the question comes whether he is any more qualified than any of those ten guys. Career value is only a small piece of the puzzle, so we should move onto peak value and the overall index. His ranking amongst these five could very well change in the process.
Peak Value
| BWAR | FWAR | WS/5 | Total | Index | |
| Baker | 58.9 | 56.6 | 56.0 | 171.5 | 354.5 |
| Nettles | 54.5 | 51.9 | 44.4 | 150.8 | 348.7 |
| Bando | 56.6 | 52.3 | 49.4 | 158.2 | 332.5 |
| Boyer | 57.0 | 49.8 | 46.2 | 153.0 | 329.5 |
| Bell | 50.8 | 47.4 | 41.2 | 139.4 | 327.6 |
It’s been awhile since one of these articles came out, so a few gentle reminders are necessary. First, the index was never designed to rank order players. We know that Baker and Nettles are similar in value. We don’t need to say one was more valuable than the other. Their similarity is the point. If Baker belongs in the Hall of Fame then Nettles likely does as well. What the index was meant to do was find areas of separation between players.
Secondly, it was meant to compare third basemen to third basemen. The fact that numerous players clear the 300 bar is noteworthy, but it isn’t necessarily a statement that they all belong in. This is especially true because if we compare third base with other positions we might find it is a stronger overall position in terms of value. Again, it is best used in a similar was as similarity scores or an extended “if….then” statement.
Offensive Numbers
| OPS+ | Rbaser | OW% | wOBA | |
| Baker | 135 | -5 | .697 | .384 |
| Bando | 119 | 11 | .594 | .346 |
| Boyer | 116 | 13 | .615 | .355 |
| Nettles | 110 | -3 | .551 | .337 |
| Bell | 109 | -17 | .533 | .335 |
The offensive and defensive numbers don’t necessarily add anything to the picture. They often explain why the index is the way that is. However, it should be noted that they have their own weaknesses. Since we use rate statistics, these numbers don’t tell us how long these players played. You could credibly say that Boyer was the second best offensive performer in the group based on his offensive winning percentage and weighted on base average.
Of course, the trouble is that his career was not nearly as long as Buddy Bell or Graig Nettles. That can be seen when we look at the difference between his peak value (top ten consecutive seasons) and his career value. We also have not seen the interplay between his offensive numbers and his defensive numbers.
Fielding Numbers
| Rfield | DWAR | TZ3B | DWS/5 | |
| Bell | 174 | 23.8 | 168 | 17.6 |
| Nettles | 140 | 21.4 | 136 | 18.4 |
| Boyer | 73 | 10.7 | 71 | 14.0 |
| Bando | 36 | 8.5 | 36 | 10.5 |
| Baker | 35 | 9.6 | 35 | 13.1 |
Fielding numbers and hitting numbers are similar in that they measure how good you were and not necessarily how long you did it. That is except for defensive win shares. That is more of a longevity type of metric. So, we see Nettles come out ahead because he did it for longer. All that being said, Boyer comes out in the middle of the pack in all four metrics. When you add in the fact that he was in the middle of the pack offensively you would be tempted to argue that he should be considered in the middle of the pack overall.
All that being said, the index never considers playoff performance and we didn’t delve into that in the book for position players. However, we know that reputations in the playoffs make a big difference. So, this is one area that actually adds to the resume for a player. That will obviously increasingly be true for players in the modern game because of expanded playoffs.
Playoff Numbers
| PA | SLASH | HR | Runs | RBI | |
| Nettles | 207 | .225/.295/.348 | 5 | 17 | 27 |
| Bando | 183 | .245/.328/.469 | 5 | 21 | 13 |
| Baker | 97 | .363/.396/.560 | 3 | 15 | 18 |
| Boyer | 30 | .222/.241/.481 | 2 | 5 | 6 |
| Bell | — | —/—/— | — | — | — |
Playoff performance is a hard category to quantify. Obviously, Baker’s performance played a huge role in his reputation. His nickname (“Home Run Baker”) came from his postseason performance. On the flip side, Bell never got the opportunity to play in the postseason because he spent most of his career in Cleveland and Texas. Neither team was ever good. Is that his fault? I suppose someone could claim they would have been better if he were better, but he was almost always either the best player or one of the best players on the team.
In between you have the other three. All three were on successful teams that won championships. Bando and Nettles won multiple championships. Yet, you could claim that Nettles went along for the ride based on his numbers. Bando was better and that might give him a leg up when it’s time for his name to be called.
BWAR MVP Points
| Top 10 | Top 5 | MVP | Points | |
| Baker | 4 | 4 | 0 | 32 |
| Boyer | 2 | 5 | 0 | 31 |
| Nettles | 3 | 0 | 2 | 29 |
| Bando | 5 | 2 | 0 | 25 |
| Bell | 3 | 2 | 0 | 19 |
The MVP tests follows the question of how often you were the best or among the best players in the league. Peak value can address this, but some players are consistently good, but never really great. The MVP tests catch the greatness angle. As you can see, four of the five guys here are pretty close. You’d expect that given their index scores. However, Nettles might get extra credit for being the most valuable player in the league twice. As you might expect, he didn’t win any MVP awards in those seasons or any others.
This is because WAR parcels out value based on positional adjustments, hitting, fielding, and base running. The MVP voters usually only consider hitting. Nettles strength was the fact that he was a good hitter and a great fielder when he was at his peak. Boyer never earned his MVP, but he was a top five player five different times. That does mean something and ultimately would get him one of my three votes if I were on the committee.