
The Hall of Fame Index: What about Jimmy Wynn?
As we move perilously close to the BBWAA Hall of Fame vote, the Veteran’s Committee vote is also coming soon. The current era on the docket is the 1950-1969 era. As we have seen in previous articles, many of the players have straddled the 1960s and 1970s, so we are forced to look at which period they achieved the most in. Our next player also straddled the period and unfortunately, perished this year.
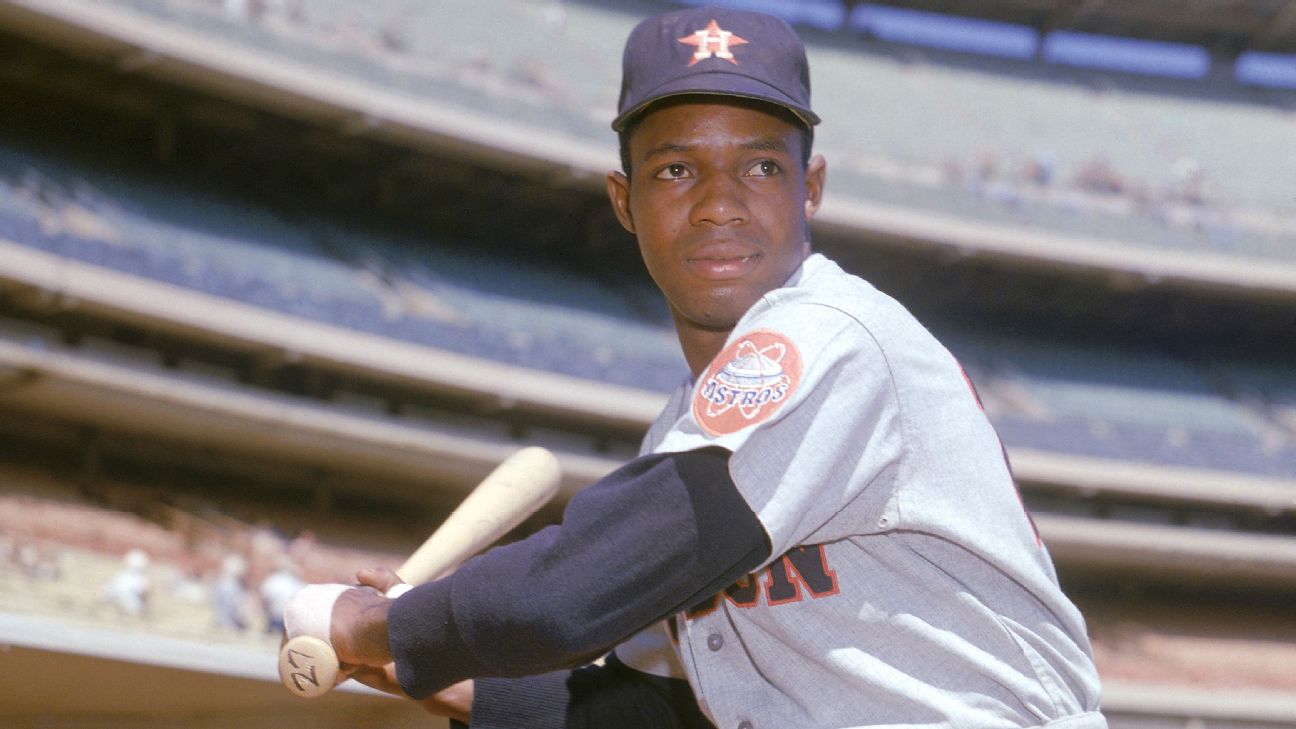
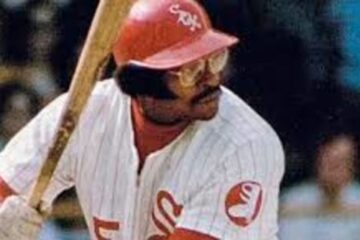
Some would consider Jimmy Wynn the greatest Astro not currently in the Hall of Fame. Of course, Lance Berkman will have a lot to say about that. As we have done with the past players we have profiled, you will see us compare Wynn to the two players above and below him on the JAWS list. It remains to be seen if the Hall of Fame index will end up seeing him the same way.
Career Value
| BWAR | FWAR | WS/5 | Total | |
| Jim Edmonds | 60.4 | 64.5 | 60.2 | 185.1 |
| Willie Davis | 60.8 | 53.7 | 64.4 | 178.9 |
| Jimmy Wynn | 55.8 | 52.8 | 61.0 | 169.6 |
| Vada Pinson | 54.2 | 47.3 | 64.2 | 165.7 |
| Cesar Cedeno | 52.8 | 49.8 | 59.2 | 161.8 |
Coming into this exercise, I sought to identify the ten players most likely to appear on the Veterans Committee ballot. So far, we have addressed Bill Freehan, Dick Allen, Gil Hodges, Ken Boyer, and Minnie Minoso. That’s roughly half. Ironically, we see three names on the above list that could end up being added, depending on how one defines the era. Wynn is obviously the main subject of this piece, but we would be remiss not to also mention Vada Pinson and Willie Davis.
The idea behind a comparison like this is essentially the same as using similarity scores. We want to know who Wynn and the others are similar to and whether those folks are Hall of Famers. None of the players above are currently Hall of Famers, but most would consider Edmonds to be an excellent candidate and when you consider that three of these players could wind up on the Veterans Committee ballot you would have to consider them to be decent candidates as well.
Of course, we also need to consider peak value. Keep in mind that in our case, peak value is defined as the best ten year stretch of the player’s career. That makes it different than JAWS’ seven year peak and when you add in the use of three statistical systems we see that JAWS and the index could wind up being a little different.
Peak Value
| BWAR | FWAR | WS/5 | Total | Index | |
| Edmonds | 52.1 | 53.5 | 46.9 | 152.5 | 337.6 |
| Wynn | 41.9 | 45.9 | 50.2 | 145.0 | 314.6 |
| Pinson | 47.6 | 42.5 | 48.2 | 138.3 | 304.0 |
| Davis | 42.9 | 38.0 | 42.8 | 123.7 | 302.6 |
| Cedeno | 47.3 | 44.8 | 46.4 | 138.5 | 300.3 |
Peak value gives a player’s career dimension. So, Wynn’s career comes into more focus here as we see some separation between him and Willie Davis. Davis played longer and may have enjoyed a little more career success, but his value takes a tumble when we look at each of them at their best. Wynn was better than all of them except for Edmonds. For many, his career was just a little too short to get him over the top, but we can see when he was at his best he was playing at a Hall of Fame level.
As for Pinson and Davis, they are both cut from a similar cloth. They were very good players that likely never achieved greatness. The index proves nothing at the end of the day. It was not designed to tell people how to vote, but to put players within a firm historical context. That usually ends up reducing players to an “if…then” type of construct. With a limit of three choices, the Veterans Committee has some difficult choices. If we assume Dick Allen and Ken Boyer are choices one and two then who gets the third vote?
Offensive Numbers
| OPS+ | Rbaser | OW% | wOBA | |
| Edmonds | 132 | -11 | .659 | .385 |
| Wynn | 129 | 18 | .651 | .362 |
| Cedeno | 123 | 57 | .610 | .353 |
| Pinson | 111 | 28 | .592 | .340 |
| Davis | 106 | 63 | .536 | .321 |
Bill James once described good statistics as taking on the characteristics of language. I have always preferred the analogy of comparing numbers to painting or drawing. A crude artist can draw stick figures. A talented artist can add perspective and dimension. These numbers don’t tell us anything different than what the index numbers tell us, but they do paint an accurate picture of a player for those that never saw them play.
Naturally, the fielding numbers will do the same. When I see players wind up with similar values despite different offensive value numbers, I can guess that they brought different skills to the game. When we consider that weighted on base average is not necessarily normed for the era they played in, we can throw that number out and see that Edmonds and Wynn are pretty similar in their offensive production. So, those growing up watching Edmonds can envision a pretty similar player in Wynn. Of course, the flip side is also true in the case of Pinson and Davis.
Fielding Numbers
| Rfield | DWAR | TZOF | DWS/5 | |
| Davis | 104 | 11.1 | 106 | 15.7 |
| Edmonds | 37 | 6.4 | 58 | 12.5 |
| Pinson | -8 | -5.7 | -6 | 13.9 |
| Cedeno | -14 | -4.3 | -8 | 10.4 |
| Wynn | -28 | -6.4 | -18 | 8.9 |
To keep things in perspective, keep in mind that each of these guys played close to fifteen seasons or more when all was said and done. Cedeno played fewer full seasons, but you get the general idea. So, Wynn averaged -2 fielding runs per season. That’s pretty dead on average when all is said and done. So, if someone calls Wynn a weak defender they are doing so only in comparison with the other guys on the list. Pinson is also more or less average by the same definition. Cedeno won’t be on this ballot, but he is also average.
Willie Davis is decidedly not average and that is the one feather in his cap. He was pretty close to average offensively, so you have to decide whether being above average offensively and good (but not historically great) defensive is enough to get him in. Edmonds for his part checks all of the boxes. He was very good offensively and is decidedly above average defensively. Why he hasn’t gotten in yet is anyone’s best guess.
Playoff Statistics
| PA | SLASH | HR | Runs | RBI | |
| Edmonds | 263 | .274/.361/.513 | 13 | 33 | 42 |
| Davis | 62 | .179/.190/.232 | 0 | 6 | 3 |
| Cedeno | 59 | .173/.271/.231 | 0 | 4 | 2 |
| Wynn | 40 | .192/.450/423 | 1 | 5 | 4 |
| Pinson | 22 | .091/.091/136 | 0 | 0 | 0 |
How does one interpret playoff numbers? The first problem is that modern players have a distinct advantage with multiple playoff rounds. This is particularly true if MLB continues with sixteen playoff teams moving forward. Secondly, you have the problem of small sample size. Are we going to call Vada Pinson a choke artist on the basis of 22 plate appearances?
That being said, Edmonds and Wynn have similar OPS scores when all is said and done. They are similar offensive performers and similar playoff performers. Edmonds has a decent lead in defense, but it is fair to look at their careers in a similar light. If we agree that Edmonds is a Hall of Famer then we might be tempted to also argue that Wynn is one. Certainly, if he isn’t a Hall of Famer then he is pretty close.
BWAR MVP Points
| Top 10 | Top 5 | MVP | Points | |
| Cedeno | 3 | 2 | 0 | 19 |
| Wynn | 1 | 3 | 0 | 18 |
| Edmonds | 4 | 1 | 0 | 17 |
| Pinson | 3 | 1 | 0 | 14 |
| Davis | 2 | 1 | 0 | 11 |
The MVP points test is meant to be similar to peak value. However, some players are strong for a few seasons and mediocre for the rest. Others are merely good for the whole decade, but never really great. The BWAR MVP points test allows us to make that comparison. Ideally, the results should be similar to the peak value results and they are in this case. They are pretty close and so are the peak value results.
A wise man once said that if ifs were a fifth we would all be drunk. If Cedeno and/or Wynn had produced one or two more prime seasons it would be academic. That ends up being the difference between them and Edmonds. He had that one or two additional season. Otherwise they are very similar players. Neither Edmonds nor Cedeno have a chance this time around, but Wynn does and here is hoping he gets just a few votes.