
A Look Back at the 2013 Draft: NL Second Basemen
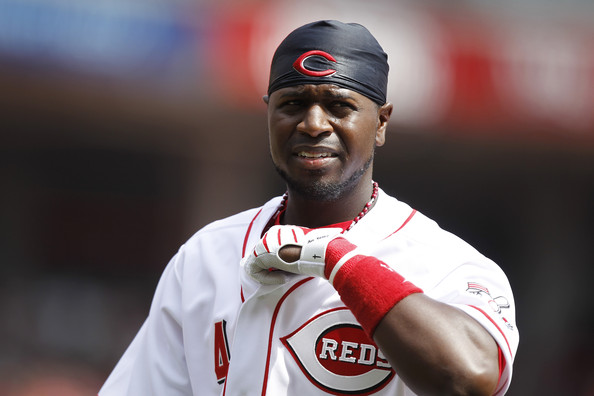
Fantasy baseball and real baseball often coincide, but there are times like this when we are painfully reminded that what makes a good fantasy player doesn’t necessarily make a good player overall. The difficulty is that teams often get confused as well. The difference between conventional numbers and the more complex numbers could not be any more plain when we consider the case of Brandon Phillips.
More fantasy owners own Phillips than any other second baseman in the National League. When we consider the amount of quality that exists in that league it is difficult to ascertain why. Robinson Cano is the only second baseman to have a higher percentage of fantasy players owning him. We could go into all of the reasons why this is the case, but before we do that, let’s go ahead and take a look at the overall table for National League second basemen. You’ll notice that the median scores for total average and batter runs far exceeds that of the American League. So, it’s not an absence of candidates.
[am4show have=’p4;p7;p3;’ guest_error=’Front Office’ ]
|
Owned |
TAV |
BR |
RC |
|
| Brandon Phillips |
98 |
.257 |
0.4 |
76 |
| Chase Utley |
95 |
.292 |
6.0 |
51 |
| Aaron Hill |
90 |
.295 |
24.7 |
108 |
| Rickie Weeks |
86 |
.264 |
-0.2 |
79 |
| Daniel Murphy |
76 |
.265 |
0.8 |
74 |
| Dan Uggla |
74 |
.271 |
2.4 |
73 |
| Marco Scutaro |
74 |
.269 |
-0.7 |
87 |
| Danny Espinosa |
72 |
.255 |
-4.4 |
74 |
| Josh Rutledge |
71 |
.256 |
-1.9 |
38 |
| Neil Walker |
65 |
.277 |
7.1 |
67 |
| Daniel Descalso |
9 |
.240 |
-13.5 |
37 |
| Mark Ellis |
6 |
.261 |
-1.1 |
52 |
| Darwin Barney |
4 |
.235 |
-17.9 |
56 |
| Donovan Solano |
3 |
.262 |
-1.8 |
38 |
| Justin Turner |
1 |
.270 |
-0.7 |
19 |
| Alexi Amarista |
1 |
.246 |
-5.3 |
30 |
| Logan Forsythe |
1 |
.275 |
4.1 |
42 |
| Steve Lombardozzi |
1 |
.249 |
-8.2 |
44 |
| Median |
—- |
.263 |
-0.7 |
54 |
We are only looking at the 2012 numbers, so we need to make sure we are giving Phillips a fair shake. Yet, when looking at the numbers we cannot help but identify the fact that Phillips is an average performer. His total average is actually below the league average while his batter runs are nearly average. The runs created total ends up finishing well above the median level and that is likely a clue as to why Phillips is selected so high. Before we really pull the covers off the Reds second sacker, let’s look at past seasons to see if 2012 was an abberation.
When we look at the same numbers we need to remember what we are looking at. Total average and batter runs are what we would call qualitative statistics. They measure the quality of the player in comparison with other players. Total average is not reliant on quantity at all while batter runs rely a little on quantity, but since it is a zero referenced number relies most on quality. Runs created on the other hand calculates from zero, so it is dependent primarily on durability. This is where Phillips shines as we will see below.
|
TAV |
BR |
RC |
|
| 2012 |
.257 |
0.4 |
77 |
| 2011 |
.280 |
16.3 |
96 |
| 2010 |
.266 |
3.3 |
86 |
| 2009 |
.259 |
0.1 |
82 |
| 2008 |
.261 |
-7.4 |
75 |
If you feel bad about picking what appears to be an average to above average player, consider that the Reds gave him ten years and 98 million dollars. So, they are paying him as if he is a top five second baseman, so why shouldn’t you draft him as if he is a top five second baseman? Walt Jocketty obviously knows what he is doing. The Reds have made the playoffs in two out of the last three seasons. What’s not to like? Well, obviously, this is what both the Reds and you were looking at over the past five seasons.
|
AVG |
HR |
R |
RBI |
SB |
|
| 2012 |
.281 |
18 |
86 |
77 |
15 |
| 2011 |
.300 |
18 |
94 |
82 |
14 |
| 2010 |
.275 |
18 |
100 |
59 |
16 |
| 2009 |
.276 |
20 |
78 |
98 |
25 |
| 2008 |
.261 |
21 |
80 |
78 |
23 |
I suppose that makes Phillips a pretty good second basemen when all is said and done. He averages close to 20 home runs and close to 20 steals a season. 20/20 guys don’t exactly grow on trees, so it makes sense that he would be in demand. You add to that a guy who came close to 90 runs a season and close to 80 runs driven and you get a guy that probably should be highly picked. Still, let’s compare his raw numbers with the raw numbers of another National League second baseman.
|
AVG |
HR |
R |
RBI |
SB |
|
| 2012 |
.280 |
14 |
62 |
69 |
7 |
| 2011 |
.273 |
12 |
76 |
83 |
9 |
| 2010 |
.296 |
12 |
57 |
66 |
2 |
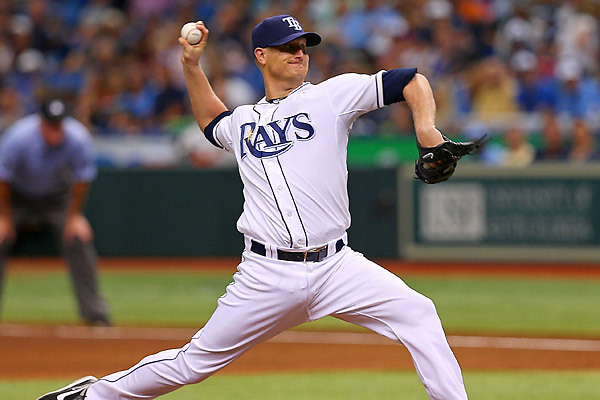
These differences are hard to ignore, but when we look at the total averages and batter runs, the second shortstop is actually slightly better. The main reason for the difference is that Phillips is extremely durable. Let’s take a look at how each guy fares when we add up the numbers on a per 500 plate appearance basis. I’ll even remove the names for both players to see if you can tell the difference. You’ll notice I haven’t identified the second player yet.
. . . . . . . . . . . . . .AVG. . . . .HR. . . . Runs. . . . .RBI
Player A. . . . . . ..283. . . . .11. . . . . .59. . . . . . .66
Player B. . . . . . …279. . . . .15. . . . ..68. . . . . . .61
We removed stolen bases because that would completely prejudice the decision. Player B was obviously Phillips adjusted to a per 500 plate appearance rate. We would still be looking north of ten steals a season for him whereas Player A would be in the neighborhood of five. The problem is that while that visually looks a lot different, an odd seven or eight steals a season is not that much in the grand scheme of things. It certainly isn’t worth an early round pick versus a middle to late round pick.
Player B (Neil Walker) is only owned in 65 percent of mixed leagues. If we take that in for a moment we realize that we have a player that is roughly comparable to Phillips in four out of five categories and yet is unowned in more than a third of the leagues playing in Yahoo. Maybe someone needs to explain that to me, because the numbers above show that to be completely ludicrous. Of course, the explanation would go along the lines of the fact that Phillips is more durable and does have an advantage on the basepaths.
No one is arguing that Walker should go before Phillips in the draft. Phillips is a more valuable fantasy player and should be drafted before Walker. The point is that the gap should not be anywhere as big as it is now. Walker is likely underappreciated (ranked tenth in ownership while ranking third in total average, second in batter runs, and eighth in runs created). Even if we take runs created (a large measure is durability) we would still find Phillips fourth among National League second basemen. That would seem to be a more apt place to rank him in lieu of first.
The art of owning a fantasy team and general managing is roughly the same in this regard. The secret is not in knowing that Brandon Phillips is better than Neil Walker. Anyone paying a little bit of attention can determine that for themselves. The key is in known how much better he is. Is he so much better than he deserves nearly ten million dollars a season? Is he so much better than he should go in the first five rounds with Walker going somewhere around round twenty? When you can accurately place guys where they should go then you can take advantage of inefficiencies like this. You can get a truly worthy guy at that selection (first five rounds) and probably get one or two more for your trouble.
[/am4show]