
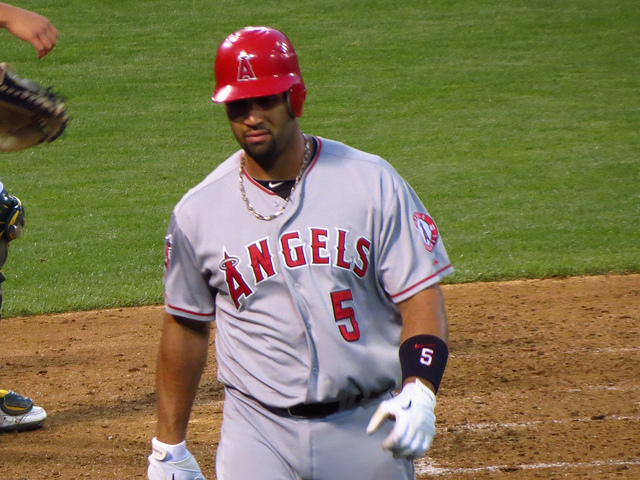
Follow the Batted Ball: Albert Pujols
It is hard for the discerning baseball fan to cull through the mountains of data that follow baseball players these days. A simple look at Baseball Reference, Baseball Prospectus, or Fangraphs can send you through a tailspin. Let’s face it, many of us are beyond obsessed when it comes to regular baseball much less fantasy baseball. So, what follows is a quick tutorial in how we can utilize some fairly complex data to help us on draft day. I’ve picked out Albert Pujols, but you can use this same methodology on just about any player.
When using these numbers it is important to put them in their proper context. When many of us were writing research papers in school we were taught the difference between primary and secondary resources. For our purposes, batted ball statistics are like the primary source. Primary source data can be dry and more difficult to use. After all, the secondary sources have already done the hard work for us. Fantasy baseball is built on those secondary sources (average, home runs, runs, RBI, stolen bases) but those numbers are built on the back of the primary source numbers. Earlier I wrote a piece about catcher sleepers and sliders and used these same numbers. In case you missed that one, I’ll give you a brief tutorial here.
Batting average on balls in play is the key number that many fans are becoming aware of. Typically, the big league average is around .300 and the old thinking was that this number was pretty much produced at random. We have become more sophisticated now and it pays for you to use that sophistication. Batted ball average (or BABIP) is dependent on other batted ball statistics. For instance, the line drive percentage a player has directly impacts a players BABIP. A higher percentage of line drives become hits and so a higher LD% predicts a higher BABIP. The reverse is also true.
We also track groundball rates and flyball rates. Normally, a higher percentage of groundballs become hits than flyballs but a higher percentage of flyballs become extra base hits. So, we want a good balance in that category, but certain positions like shortstop, second base, and center field have speed players that need higher groundball rates. With flyballs we also track the percentage that become home runs. Normally we see a breakdown of 18/42/40 in terms of line drives, groundballs, and flyballs. Ten percent of flyballs become home runs, but that rate is heavily dependent on a player’s home ballpark. When we look at these primary numbers we immediately see why our superstars are our superstars. Albert Pujols is no different.
The last number we include is the player’s contact rate. The normal contact rate tends to hover between 80 and 85 percent. Contact rate isn’t necessarily the end all be all, but it does give us a clue as to which players will tend to hit for higher average and which ones are the Rob Deer types. As you might imagine, Adam Dunn and Mark Reynolds would tend to fall on the bottom of the contact hierarchy. Albert Pujols was near the top when he was in his prime, but his average has dipped in recent seasons. So, is that in response to other decay within his batted ball realm or has he been unlucky? Here are the last five seasons of Albert Pujols’ baseball life.
|
BABIP |
Contact |
LD% |
GB% |
FB% |
HR/FB |
|
| 2012 |
.282 |
84.8 |
18.8 |
41.3 |
39.9 |
14.0 |
| 2011 |
.277 |
86.6 |
17.0 |
44.7 |
38.3 |
18.3 |
| 2010 |
.297 |
85.4 |
17.2 |
38.3 |
44.5 |
18.3 |
| 2009 |
.299 |
86.6 |
15.6 |
38.7 |
45.7 |
20.1 |
| 2008 |
.340 |
90.1 |
22.4 |
40.2 |
37.4 |
20.7 |
The BABIP scores have been pretty steadily below average and that can be directly tied to his line drive rate. In 2008, his line drives were extremely high and so was his BABIP. So, Pujols has not been victim to bad luck as much as he has seen his skills decline steadily. That can be seen in his line drive rates, contact rates, and home runs per flyball rates. Now, it could be said that he did suffer from a little bad luck a year ago. There is nothing to explain the rapid decline in his home run rate other than Los Angeles being a more difficult place to hit. Even still, most of his misfortune came early in the season when he couldn’t buy a home run. His line drive rate even bounced back some, but it didn’t seem to help him in the batting average category.
The implication of all of these numbers are clear: Albert Pujols is in decline. Sure, we all knew that. Baseball players don’t stay on top of the baseball world for 20 years. Pujols came up young and was dominant from the get go. It was easy to get sucked into the notion that Pujols was always going to be dominant. As he enters his mid thirties we will see that home run rate drop to more normal levels and the contact rate is also almost there. We didn’t include it, but the walk rate has already returned to normal and is threatening to be below average. There is nothing more sinister or dangerous in the fantasy world than the memory of a great player. Pujols was still picked number one overall in fantasy leagues as recently as last season. He shouldn’t even be a first rounder these days, but rest assured, some of you will have players in your league tempted to take him with their number one pick. Let them and then laugh all the way to the bank.