
2018 Fantasy Baseball: Top Ten Fantasy Centerfielders
Center field is as deep a position as there is in baseball. Defense isn’t a consideration in fantasy baseball circles, but it plays a considerable impact in who plays center field. Of course, this is where we get into some murky areas. Some players play enough games in center field to be eligible even if they are primarily left and right fielders. We are profiling players that were primarily center fielders last season. I know that skews the rankings some, but we want to avoid profiling players twice.
Rankings players across platforms and league types is an inexact science at best. We make our best guess and issue our rankings for readers and critics alike. We consider standard five category rankings, six category leagues (walks), and total points. Total points is a newer format that primarily is used in daily fantasy leagues, but is becoming more popular in season long leagues. Since some of you may be unfamiliar with total points we are including our formula below.
Total Points = Total Bases + Runs + RBI + SB + BB + HBP – SO – CS – GIDP
Mike Trout – Los Angeles Angels
| G | TP | Rank | TP/G | Rank | |
| 2017 | 114 | 438 | 3.84 | ||
| 2016 | 159 | 533 | 3.35 | ||
| 2015 | 159 | 470 | 2.96 | ||
| 2014 | 157 | 479 | 3.05 | ||
| 2013 | 157 | 535 | 3.41 | ||
| AVG | 149 | 491 | 1 | 3.30 | 1 |
Aggregate: .306, 33 HR, 109 Runs, 94 RBI, 22 SB, 99 BB 5 Category: 1
Per 162: .306, 35 HR, 121 Runs, 100 RBI, 29 SB, 100 BB 6 Category: 1
Steamer: .309, 39 HR, 115 Runs, 109 RBI, 21 SB, 113 BB DRS: -6
In case you haven’t been paying attention, 500 points in total points is an excellent season. Only a handful of guys have done it over the past five seasons. To nearly average that sum is ridiculously good. Averaging nearly four points per game is so good it’s stupid. People sometimes ask when the next Mike Trout will come up. There is a reason why they call them once in a generation players.
Charlie Blackmon—Colorado Rockies
| G | TP | Rank | TP/G | Rank | |
| 2017 | 159 | 568 | 3.57 | ||
| 2016 | 143 | 472 | 3.30 | ||
| 2015 | 157 | 400 | 2.55 | ||
| 2014 | 154 | 378 | 2.45 | ||
| 2013 | 82 | 139 | 1.70 | ||
| AVG | 139 | 391 | 3 | 2.81 | 2 |
Aggregate: .308, 22 HR, 92 Runs, 68 RBI, 22 SB, 38 BB 5 Category: 2
Per 162: .305, 24 HR, 102 Runs, 75 RBI, 24 SB, 42 BB 6 Category: 2
Steamer: .297, 26 HR, 103 Runs, 78 RBI, 18 SB, 52 BB DRS: -5
Blackmon is one of the few players to eclipse 500 points in the last few years and arguably could have been an MVP candidate. Of course, you have to put those numbers through the Coors Field decoder ring. As a fantasy player, you shouldn’t care if those numbers occur at sea level or on the moon. As you can see from the total points, Blackmon has been getting better by the season, but he really doesn’t have anywhere to go and the Steamer numbers back that up.
Andrew McCutchen—Pittsburgh Pirates
| G | TP | Rank | TP/G | Rank | |
| 2017 | 156 | 416 | 2.67 | ||
| 2016 | 153 | 332 | 2.17 | ||
| 2015 | 157 | 437 | 2.78 | ||
| 2014 | 146 | 454 | 3.11 | ||
| 2013 | 157 | 467 | 2.97 | ||
| AVG | 154 | 421 | 2 | 2.73 | 3 |
Aggregate: .292, 24 HR, 90 Runs, 86 RBI, 15 SB, 80 BB 5 Category: 3
Per 162: .291, 24 HR, 98 Runs, 87 RBI, 21 SB, 82 BB 6 Category: 3
Steamer: .283, 23 HR, 79 Runs, 80 RBI, 9 SB, 73 BB DRS: -14
2017 marks four consecutive subpar defensive seasons for McCutchen. That and the fact that his contract will be up following 2018 has the Pirates looking for takers on McCutchen. Obviously, moving to a contender would change his outlook some. He did have a bit of a renaissance in the second half last season, so he still could be an all-star performer if he could move to a lineup with a little more support around him.
George Springer—Houston Astros
| G | TP | Rank | TP/G | Rank | |
| 2017 | 140 | 434 | 3.10 | ||
| 2016 | 162 | 400 | 2.47 | ||
| 2015 | 102 | 235 | 2.30 | ||
| 2014 | 78 | 167 | 2.14 | ||
| AVG | 121 | 309 | 5 | 2.55 | 4 |
Aggregate: .263, 25 HR, 83 Runs, 65 RBI, 9 SB, 60 BB 5 Category: 9
Per 162: .266, 33 HR, 112 Runs, 87 RBI, 12 SB, 81 BB 6 Category: 6
Steamer: .275, 33 HR, 106 Runs, 87 RBI, 11 SB, 76 BB DRS: -2
Magical thinking is dangerous this time of year. From Game Three of the World Series through Game Seven, Springer was the best player on the planet. Magical thinking involves expecting that to carry over. It rarely ever does. If Springer is to take a step forward it will come in the area of health. He has missed significant time in three out of four seasons. If he can enjoy the health he had in 2016 he will have taken a significant step forward.
Adam Eaton—Washington Nationals
| G | TP | Rank | TP/G | Rank | |
| 2017 | 23 | 78 | 3.39 | ||
| 2016 | 157 | 380 | 2.42 | ||
| 2015 | 153 | 363 | 2.37 | ||
| 2014 | 123 | 273 | 2.22 | ||
| 2013 | 66 | 130 | 1.97 | ||
| AVG | 104 | 245 | 15 | 236 | 8 |
Aggregate: .284, 7 HR, 66 Runs, 37 RBI, 11 SB, 39 BB 5 Category: 20
Per 162: .284, 11 HR, 104 Runs, 57 RBI, 17 SB, 62 BB 6 Category: 17
Steamer: .282, 12 HR, 84 Runs, 56 RBI, 14 SB, 57 BB DRS: -5
Placing Eaton in the top five is a bit risky given his injury history, but the ACL tear was a bit of a fluke and he was off to a brilliant start to the season. When you consider the offensive talent around him you have to expect him to produce a ton of runs in a healthy season. Like many of the other guys, he gives you a little bit of everything. You have to like guys that fill up the stat sheet.
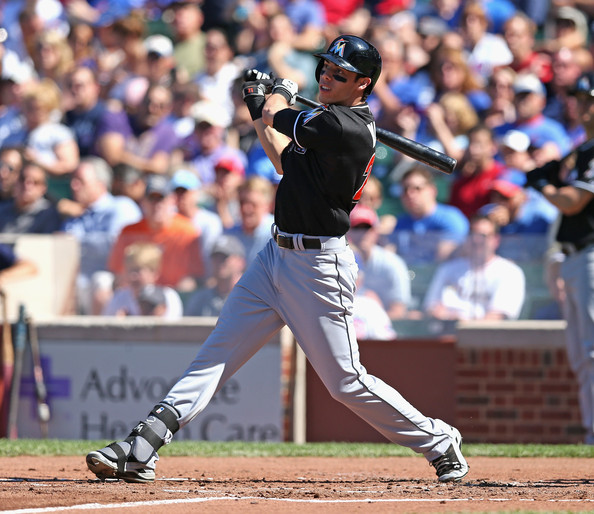
Christian Yelich—Miami Marlins
| G | TP | Rank | TP/G | Rank | |
| 2017 | 156 | 395 | 2.53 | ||
| 2016 | 155 | 378 | 2.44 | ||
| 2015 | 126 | 251 | 1.99 | ||
| 2014 | 144 | 323 | 2.24 | ||
| 2013 | 62 | 117 | 1.89 | ||
| AVG | 129 | 293 | 10 | 2.27 | 10 |
Aggregate: .290, 14 HR, 74 Runs, 59 RBI, 14 SB, 60 BB 5 Category: 4
Per 162: .290, 15 HR, 93 Runs, 74 RBI, 18 SB, 76 BB 6 Category: 4
Steamer: .292, 19 HR, 81 Runs, 79 RBI, 11 SB, 74 BB DRS: -6
No one’s ranking is more volatile than Yelich’s. For one, he’s discovered a power stroke in the last two seasons he hadn’t before. Yet, the Marlins just traded away Marcell Ozuna, Giancarlo Stanton, and Dee Gordon, so if he stays in Miami he will have fewer run producing opportunities. If he gets dealt he will not only have more talent around him, but his home/road splits predict considerably more power. So, you should adjust accordingly if he gets moved.
Adam Jones—Baltimore Orioles
| G | TP | Rank | TP/G | Rank | |
| 2017 | 147 | 337 | 2.29 | ||
| 2016 | 152 | 357 | 2.35 | ||
| 2015 | 137 | 326 | 2.38 | ||
| 2014 | 159 | 378 | 2.38 | ||
| 2013 | 160 | 423 | 2.64 | ||
| AVG | 151 | 364 | 4 | 2.41 | 6 |
Aggregate: .277, 29 HR, 86 Runs, 88 RBI, 6 SB, 29 BB 5 Category: 5
Per 162: .278, 26 HR, 89 Runs, 86 RBI, 9 SB, 30 BB 6 Category: 11
Steamer: .274, 29 HR, 85 Runs, 86 RBI, 3 SB, 32 BB DRS: -12
There are a number of players over the years that continually produce good numbers every year, but have holes in their game that prevent them from being a legitimate superstar. In Jones’ case he simply doesn’t draw enough walks. He also doesn’t have the elite glove that gives a player elite value. The Orioles will have to make a call on whether to commit their future to a flawed star.
A.J. Pollock—Arizona Diamondbacks
| G | TP | Rank | TP/G | Rank | |
| 2017 | 112 | 298 | 2.66 | ||
| 2015 | 157 | 469 | 2.99 | ||
| 2014 | 75 | 179 | 2.39 | ||
| 2013 | 137 | 240 | 1.75 | ||
| AVG | 120 | 297 | 9 | 2.48 | 5 |
Aggregate: .288, 12 HR, 72 Runs, 47 RBI, 21 SB, 35 BB 5 Category: 10
Per 162: .286, 16 HR, 95 Runs, 62 RBI, 28 SB, 48 BB 6 Category: 12
Steamer: .282, 21 HR, 89 Runs, 76 RBI, 25 SB, 53 BB DRS: +8
Unfortunately, attendance matters, but if you are a daily fantasy baseball player then A.J. Pollock should be a top five center fielder. He does enough of everything to be a nice pickup. If you hedge your bets on draft day you can add him and then select a steady performer as a bench player for insurance. Steamer seems to think he will be healthy, so there is room for some optimism.
Lorenzo Cain—Free Agent
| G | TP | Rank | TP/G | Rank | |
| 2017 | 155 | 355 | 2.29 | ||
| 2016 | 103 | 217 | 2.11 | ||
| 2015 | 140 | 393 | 2.81 | ||
| 2014 | 133 | 236 | 1.77 | ||
| 2013 | 115 | 184 | 1.60 | ||
| AVG | 129 | 277 | 12 | 2.15 | 12 |
Aggregate: .289, 10 HR, 70 Runs, 55 RBI, 22 SB, 36 BB 5 Category: 7
Per 162: .290, 12 HR, 86 Runs, 69 RBI, 27 SB, 44 BB 6 Category: 10
Steamer: .288, 15 HR, 75 Runs, 70 RBI, 16 SB, 45 BB DRS: +5
Like Yelich, Cain’s ultimate placement depends on where he lands. He has been linked to multiple teams including the Giants, Rangers, Blue Jays, and Mets, and of course the Royals. If he lands in Texas it could be a significant boost to his numbers. The Mets and Giants would not be good for his offensive numbers. The Blue Jays and Royals would be neutral. So, we are in wait and see mode.
Dexter Fowler—St. Louis Cardinals
| G | TP | Rank | TP/G | Rank | |
| 2017 | 118 | 297 | 2.52 | ||
| 2016 | 125 | 308 | 2.46 | ||
| 2015 | 156 | 337 | 2.16 | ||
| 2014 | 116 | 231 | 1.99 | ||
| 2013 | 119 | 253 | 2.13 | ||
| AVG | 127 | 285 | 11 | 2.24 | 11 |
Aggregate: .266, 14 HR, 77 Runs, 47 RBI, 14 SB, 71 BB 5 Category: 12
Per 162: .268, 13 HR, 95 Runs, 55 RBI, 18 SB, 85 BB 6 Category: 7
Steamer: .259, 18 HR, 88 Runs, 65 RBI, 12 SB, 85 BB DRS: -18
Fowler is a fascinating study. He began his career in Denver and most people assumed his offensive ability was driven by the thin air. However, he has played in three different cities since then and he has been equally effective at sea level. He has even developed more power since leaving Denver. Fowler is an interesting study in value as his numbers don’t jump off the page, but he could be a more valuable player than Jones if he can remain healthy.