
The Hall of Fame Index: Who is the most fit starting pitcher out of the Hall of Fame?
Starting pitching is a considerably more difficult group to profile when it comes to the Hall of Fame. There are just too many differences across time to effectively treat all starting pitchers the same. If we were to take the top five starting pitchers according to the index on the outside looking in we would almost exclusively focus on the 19th century. That seems a little out of whack given that most of them pitched for just over ten years and logged well over 400 innings a season.
Those guys deserve their due, but the debate is much more concentrated on the here and now. So, I decided to take a look at the top five pitchers out of the Hall of Fame from after World War II. We will exclude Roger Clemens for the same reasons that we excluded the likes of Barry Bonds, Manny Ramirez, Sammy Sosa, and Rafael Palmeiro (just to name a few).
Career Value
| BWAR | FWAR | WS/5 | Total | |
| Curt Schilling | 79.5 | 78.9 | 50.4 | 208.8 |
| Kevin Brown | 67.8 | 76.0 | 48.4 | 192.2 |
| Rick Reuschel | 69.5 | 69.4 | 48.0 | 186.9 |
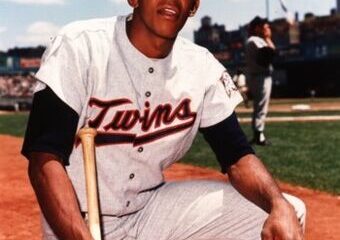
| Luis Tiant | 66.1 | 55.1 | 51.2 | 172.4 |
| David Cone | 62.3 | 56.7 | 41.0 | 160.0 |
Judging by book sales, few of you have purchased The Hall of Fame Index Part II. It goes into much more detail on how the index works. It wasn’t designed to end debate. It provides information for voters and dedicated fans. If I have encountered anything in the online comments it is usually, “why isn’t this player in the Hall of Fame or why wasn’t this guy mentioned?” The answer to that is simple. I’m profiling the top four or five guys at each position that are on the outside looking in.
The question of whether any individual player is a Hall of Famer is a nebulous one. There are hardened opinions on both sides on nearly every player. The index and the assortment of tests try to consider as much data as we can to provide evidence. The question here is simply which player is the most fit. That’s a different question. It doesn’t mean any particular player is not fit. It just means someone might be more fit.
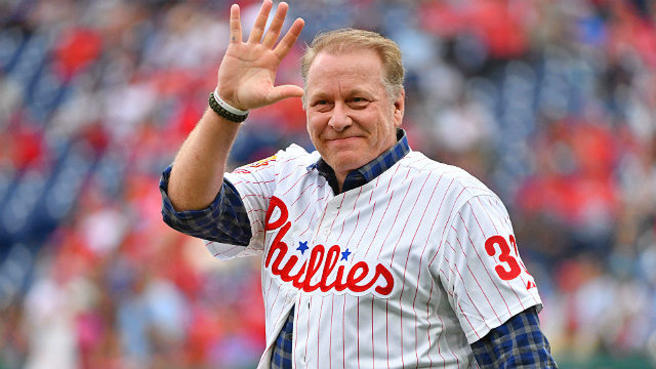
Here it looks like Schilling is the most fit, but we have to remember peak value. He is still on the BBWAA ballot, so his case is the easiest to rectify. It also might be the most complex given what has happened with him after his playing career. We will have to get into that, but we will do that on the other side of the peak value numbers.
Peak Value
| BWAR | FWAR | WS/5 | Total | Index | |
| Schilling | 59.5 | 59.3 | 36.2 | 155.0 | 363.8 |
| Brown | 54.0 | 58.1 | 35.6 | 147.7 | 339.9 |
| Reuschel | 51.1 | 47.8 | 32.0 | 130.9 | 317.8 |
| Tiant | 45.9 | 36.0 | 38.6 | 120.5 | 292.9 |
| Cone | 53.7 | 45.3 | 32.4 | 131.4 | 291.4 |
If you have been following along with the articles you know 300 is a kind of benchmark for fitness. That number gets thrown out the window with pitchers. As you can clearly see, win shares doesn’t give pitchers nearly as much credit as the WAR formulas do. We could go into depth about why that is, but I’ll save that heavy lifting for the book. It does have a profound effect on how we end up viewing guys that fall short of the 300 win plateau.
Schilling is clearly the most fit statistically so far. He has the highest career and peak value to give him a huge lead in the overall index. So, why is he still on the outside looking in? Well, in plain English, he’s an ass. He has made numerous controversial statements about politics and gotten himself blackballed from ever commentating on the game. He also declared personal bankruptcy when a video game he invested in went belly up.
Jay Jaffe did a great job of chronicling the different problems with his personal life in his book The Cooperstown Casebook. He came to pretty much the same conclusion with his JAWS formula as the index did here. I hate it when people talk badly about the moral argument by sarcastically asking “where do we draw the line?” Well, the equally snarky answer is that we draw it somewhere. We don’t want murderers in the Hall of Fame. Schilling is nowhere close to that. He’s a jackass, but we have plenty of those enshrined. If we look at the pitching numbers, postseason pitching, and the Cy Young points we will see why he belongs there.
Pitching Statistics
| Wins | PCT | ERA+ | WaaPCT | Diff | |
| Schilling | 216 | .597 | 127 | .595 | .002 |
| Brown | 211 | .594 | 127 | .583 | .011 |
| Cone | 194 | .606 | 121 | .579 | .027 |
| Reuschel | 214 | .528 | 114 | .568 | -.040 |
| Tiant | 229 | .571 | 114 | .559 | .012 |
If you hear any statistical argument against any of these guys it usually begins and ends with them winning only _____ number of games. Heck, Cone didn’t even get to 200 wins, so what in the heck is he doing on a list like this? Simply put, the number of wins a pitcher earns has a lot less to do with him than what it has to do with the hitters in his lineup and the fielders behind him. In the modern game you can add the quality of the bullpen to that.
Wins are to pitchers what batting average is to hitters. It’s a very eye-popping number that means very little. I like WAApct because it tells us what the pitcher’s winning percentage would have been with average run support and fielding support. Lee Sinins in his encyclopedia converted those into neutral wins and neutral losses. Either way, Schilling ended up right where he should be. Of course, this ignores the no decisions and what might have happened with better run support or bullpen support.
What we do see is that Brown wasn’t all that different, but his vote tallies in the BBWAA say otherwise. There are a number of reasons for that. He was a little more caught up in the steroids scandal than Schilling, but the biggest reason is probably how postseason performance gets weighted. How much weight one gives to playoff performance is obviously up to them.
Playoff Numbers
| W-L | INN | ERA | SO/BB | |
| Schilling | 11-2 | 133.1 | 2.23 | 120/25 |
| Cone | 8-3 | 111.2 | 3.80 | 94/58 |
| Brown | 5-5 | 81.2 | 4.19 | 71/31 |
| Tiant | 3-0 | 34.2 | 2.86 | 20/11 |
| Reuschel | 1-4 | 32.1 | 3.85 | 14/12 |
Schlling legitimately has the reputation for being one of the biggest big game pitchers in baseball history. Everyone remembers the bloody sock, but he was also the 2001 World Series MVP with the Diamondbacks. This is the one tangible difference we can see between Schilling and Brown. Of course, Brown was instrumental in the Marlins winning their second World Series and he carried the Padres on his back the next season.
Unfortunately, the overall numbers don’t jump off the page and that is what people will know the further and further we get away from his career. Tiant has his fans and those fans would be right to point out that he was brilliant in limited action in the playoffs. Unfortunately, his teams never won the World Series.
The pitcher that gets the biggest rap here is probably Reuschel. His numbers aren’t bad, but he came away with a losing record. If you look at his overall pitching numbers you can see he was the only one to have a worse winning percentage than what his expected winning percentage should be. I’m definitely tempted to say he was the most underrated pitcher of the group.
BWAR Cy Young Points
| Top 10 | Top 5 | CY | PTS | |
| Schilling | 3 | 8 | 0 | 49 |
| Reuschel | 3 | 5 | 1 | 44 |
| Brown | 1 | 3 | 2 | 38 |
| Cone | 1 | 5 | 1 | 38 |
| Tiant | 5 | 2 | 1 | 35 |
Anyone can interpret these numbers any number of ways. Schilling is the only one not to deserve a Cy Young award, but he finished in the top five in WAR eight different times. He finished in the top ten an additional three times. That is more than two-thirds of his career finishing somewhere in the top ten. In the modern age that’s pretty remarkable.
Of course, articles have been written about how WAR breaks down when you start considering it on a single season basis. Mike Minor would have been a serious Cy Young candidate according to WAR last season when everyone knows he wasn’t a top five pitcher. So, maybe we should take these results with a pillar of salt. We should pay attention in the same way we pay attention to all of the other tests. They tell us the same thing.
The BBWAA needs to stop messing around and elect Schilling into the Hall of Fame. The rest would be considered by the Veterans Committee and I have my own preferences there, but all four would be decent candidates as well. Brown has a little on the others in terms of the index, but that is obviously open to interpretation.