
The Hall of Fame Index: The Ballad of Bobby Grich
I’ve released a few Hall of Fame Index articles and hinted around the whole idea behind the index in the first place, but rather than talk in the abstract it usually more instructive to bring up a concrete example I call the “Bobby Grich test.” The old guard in the BBWAA have long maintained that they know the difference between a Hall of Famer and someone that shouldn’t get in. Let’s put that to the test.
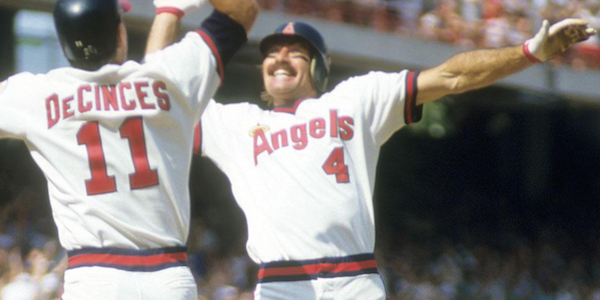
For those that aren’t aware, Grich primarily played for the Orioles and Angels in the 1970s and 1980s. He was never thought of as one of the best players in the league. He had a good reputation, but his value was never recognized. This is because he was exceptionally good at two skills that the old guard never recognized. First, he was an exceptional defensive second baseman, but he wasn’t one that would wind up on the highlight reel every night. Secondly, he got on base at an incredible clip. Let’s start with the standard five fantasy numbers between him and the Hall of Famers he would most favorably compare to.
| AVG | HR | Runs | RBI | SB | |
| Craig Biggio | .281 | 291 | 1844 | 1175 | 414 |
| Ryne Sandberg | .285 | 282 | 1318 | 1061 | 344 |
| Roberto Alomar | .300 | 210 | 1508 | 1134 | 474 |
| Bobby Grich | .266 | 224 | 1033 | 864 | 104 |
Obviously, the numbers here alone show a huge difference. The problem (and the same would occur if we included hits) is that not all of these events are created equal. Run scoring (and producing) events require teammates to get involved. So, looking at those in a vacuum tell us as much about the quality of their teammates as it does them. Now, we aren’t even going to get into the index or fielding yet. We are simply looking at other offensive indicators that distill out the impact of teammates.
| SEC | H+BB | TB | RC | OPS+ | |
| Biggio | .285 | 4225 | 4711 | 1832 | 112 |
| Sandberg | .286 | 3157 | 3787 | 1382 | 114 |
| Alomar | .296 | 3756 | 4018 | 1575 | 116 |
| Grich | .318 | 2921 | 2919 | 1127 | 125 |
Here, we see a clear delineation between what we might call rate statistics and counting statistics. Grich did not enjoy the longevity of those other three guys (the same is true when we include other near misses like Lou Whitaker). However, the other three played in the 1980s and 1990s (and 2000s in some cases) where Grich played in the 1970s and 1980s. Those were slightly different eras, so the OPS+ reflects some of those differences. According to that metric he was a more valuable offensive player during his time in comparison with the league than the others.
The case does not end there. Any discussion of Grich has to include the advantage he had with the glove. What we can do here is look at the independent fielding numbers of all of our individual components of the index. We could look at Gold Gloves, but as you will undoubtedly see, Gold Gloves are not terribly scientific when it comes to identifying the best fielder in any particular season.
| Rfield | UZR | FRAA | GG | |
| Biggio | -100 | -70.3 | -113.1 | 4 |
| Sandberg | +60 | +103.9 | +92.9 | 9 |
| Alomar | -38 | +15.8 | +6.3 | 10 |
| Grich | +82 | +134.1 | +14.3 | 4 |
Ask any casual fan to name the best defensive second baseman in the group and they likely would pick Alomar. Why? Well, he won ten Gold Gloves and always seemed to wind up on Sportscenter with a spectacular play. Grich played before the Sportscenter revolution, but he likely wouldn’t have wound up on it much because he didn’t need to make the spectacular play to get the assist or putout.
We could go into depth about the differences between the various formulas on fielding, but that would take up entirely too much time. Each uses play by play data to determine the difficulty of a play and whether they would expect the average player to make it. They each have varying opinions and that represents the bulk of the difference between the three platforms on total WAR.
However, what you see is a general consensus. Grich and Sandberg were generally regarded as superior fielders than Alomar and Biggio. Biggio was a disaster, but he also played four different positions in his career. Suffice it to say, he did not deserve his Gold Gloves because they best you could say was that he was mediocre. Naturally, no one should use these numbers to argue that Grich was definitely the best fielding second baseman of the bunch. Yet, it should be obvious that he was a very good fielder and a very good offensive player in his time. When you combine those two elements you get greatness.
Career Value
| bWAR | fWAR | WARP | Total | |
| Bobby Grich | 70.9 | 69.1 | 56.6 | 196.6 |
| Craig Biggio | 65.1 | 65.8 | 60.2 | 191.1 |
| Roberto Alomar | 66.8 | 63.6 | 59.8 | 190.2 |
| Ryne Sandberg | 67.5 | 60.9 | 59.1 | 187.5 |
Anyone that looks at this table and concludes that Grich was better than the other three is missing the point. We are talking about a separation of two wins over the course of fifteen seasons. That’s assuming you grant equal weight to all three platforms. People with far more credentials than me will tell you why one is better than the other. I’m not here to dispute their wisdom and expertise.
The overall point is that Grich is just as qualified if not more qualified for the Hall of Fame than they were, but was largely ignored. Thus, we have disproved the notion that the writers know a Hall of Famer when they see one. Often, a player’s greatness is overlooked when that greatness comes from the little things. Perhaps that can best be seen when looking at their peak value. Peak value in our case is judged by adding up their WAR over their best ten year stretch.
Peak Value
| bWAR | fWAR | WARP | Total | |
| Ryne Sandberg | 56.2 | 51.6 | 51.0 | 158.8 |
| Bobby Grich | 55.2 | 52.3 | 42.9 | 150.4 |
| Craig Biggio | 53.0 | 51.3 | 45.8 | 150.1 |
| Roberto Alomar | 53.5 | 47.6 | 46.8 | 147.9 |
Again, the distribution of scores here are very close. One could reasonably sit in a sports bar for hours and debate the merits of any of these guys. The point is that if all three belong in the Hall of Fame then so does Grich. He fits right into the conversation and there is really no other way of putting it. Unfortunately, the peak value doesn’t match with what the sports writers thought of him in the day.
Grich finished in the top ten twice (8th and 9th) and got votes in a few other seasons, but was forgotten for the most part. He finished in the top ten in WAR four times and when you throw in offensive WAR you see that he finished in the top ten seven different times. The BBWAA could hardly be blamed for this. Most of us had little concept of value at the time. We focused on batting average, home runs, and stolen bases just like everyone else.
Hall of Fame Index
| Career | Peak | Total | |
| Bobby Grich | 196.6 | 150.4 | 347.0 |
| Ryne Sandberg | 187.5 | 158.8 | 346.3 |
| Craig Biggio | 191.1 | 150.1 | 341.2 |
| Roberto Alomar | 190.2 | 147.9 | 338.1 |
The index does not put an end to the debate. It crystallizes it. It refines it and puts it in its proper scope. Grich is not better than Sandberg based on .7 of a win. That’s seven runs. What it does do is give us some reference for a conversation. The same is true for Biggio and Alomar. All of us have our personal preferences based on who we are a fan of and the time in which we became fans. The sad thing is Grich was not only denied his plaque, but his place in that conversation. Hopefully, we can fix that part of the deal.